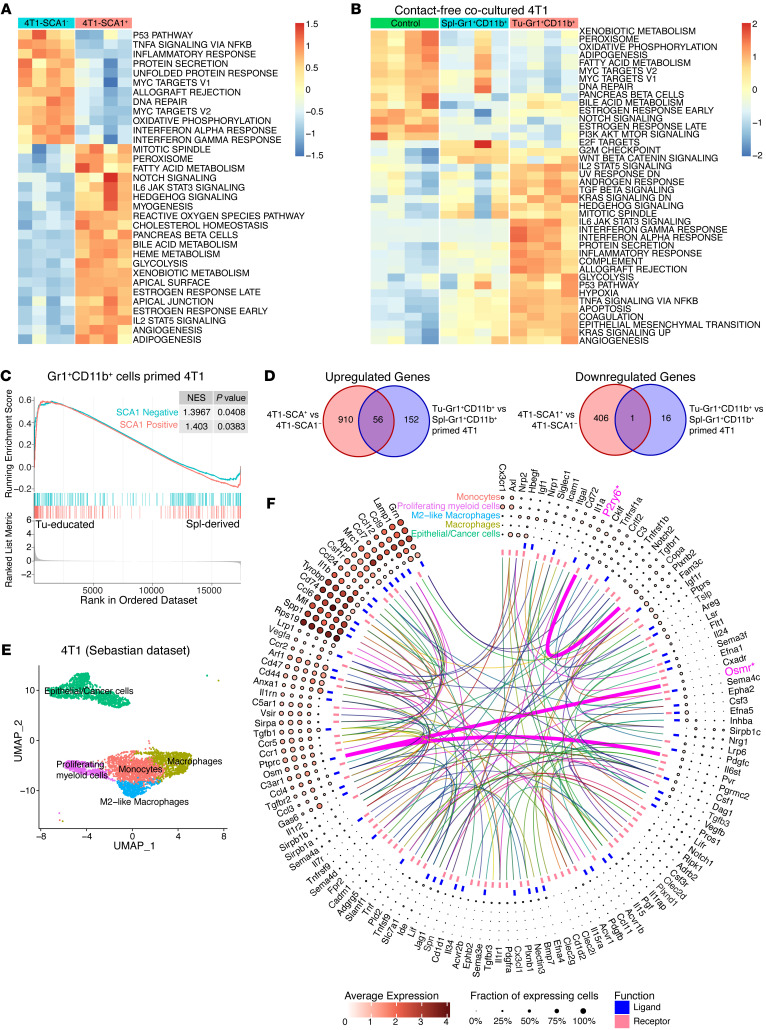
Figure 3. Transcriptomic analysis of SCA1+ tumor cells.
(A) Heatmap showing the signature score of the hallmark pathways analysis in 4T1-SCA1+ and 4T1-SCA1– populations sorted from parental 4T1 cells. The colors code the expression levels relative to average levels, as indicated at the bottom. (B) Heatmap showing the signature score of the hallmarks pathway analysis in parental 4T1, Spl-Gr1+CD11b+–primed 4T1, and Tu-Gr1+CD11b+–primed 4T1 cells. The colors code the expression levels relative to average levels, as indicated at the bottom. (C) GSEA comparing the Tu-Gr1+CD11b+– and Spl-Gr1+CD11b+–primed 4T1 cells. GSEA shows positive correlations of both SCA1-positive and SCA1-negative signatures. NES, normalized enrichment score. (D) Venn diagrams showing that 56 upregulated genes and 1 downregulated gene are shared between inherent and Tu-Gr1+CD11b+–induced SCA1+ population in 4T1 tumor cells. (E) UMAP plot showing clusters of cancer cells and myeloid cell populations in orthotopically grown 4T1-derived PTs extracted from the Sebastian data set (see Methods for details). (F) Circos diagram showing the predicted potential interactions between cancer cells and different myeloid cell populations determined by CellPhoneDB (see Supplemental Methods for details) based on the Sebastian data set. Only Osmr and P2ry6 are shared with the common 56 gene list shown in panel D.

