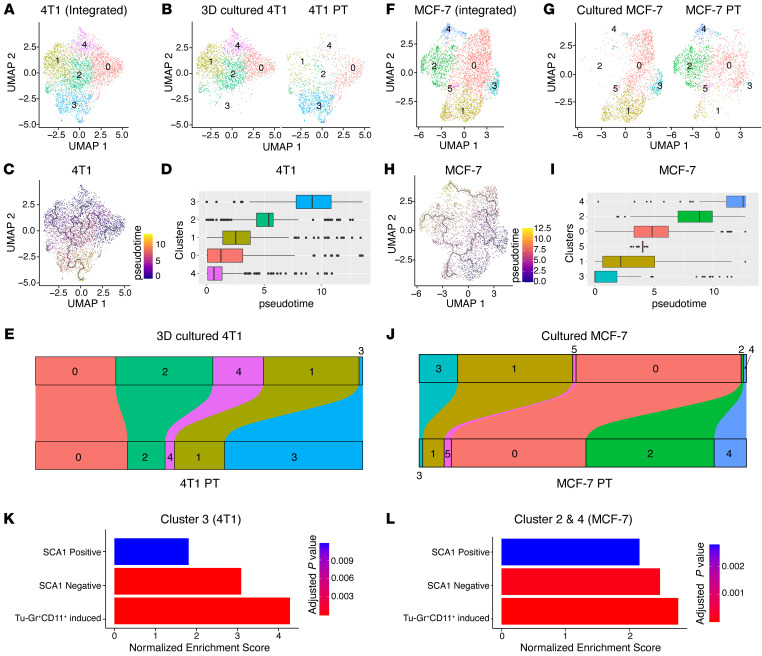
Figure 4. Transformation dynamics of tumor cell populations induced by the TME.
(A) UMAP plots showing 4T1 clusters based on integrated scRNA-Seq data from 4T1 cells in 3D culture or in PT. (B) Distribution of specific clusters in 4T1 cells in 3D culture or PT. (C and D) UMAP plot (C) and box plot (D) showing the clusters in pseudo-time course during the transformation of 4T1 cells from ex vivo culture to in vivo. (E) Sankey diagram showing the dynamic of each cluster during the transformation of 4T1 cells from ex vivo culture to in vivo. Cluster 3 was largely expanded in vivo. (F) UMAP plots showing MCF-7 clusters based on integrated scRNA-Seq data from MCF-7 cells in culture or in PT. (G) Distribution of the specific clusters in cultured MCF-7 cells or MCF-7 PTs. (H–I) UMAP plot (H) and box plot (I) showing the clusters in pseudo-time course during the transformation of MCF-7 cells from ex vivo culture to in vivo. (J) Sankey diagram showing the dynamic of each cluster during the transformation of MCF-7 cells from ex vivo culture to in vivo. Clusters 2 and 4 were largely expanded in vivo. (K and L) GSEA analysis of SCA1-positive signature, SCA1-negative signature, and Tu-Gr1+CD11b+–induced signature of cells in cluster 3 in 4T1 data (K) and in cluster 2 and cluster 4 in MCF-7 data (L). Analyses are based on publicly available data (4T1: GEO GSM4812003 and GSM3502134; MCF-7: GEO GSM4681765 and GSM5904917).

