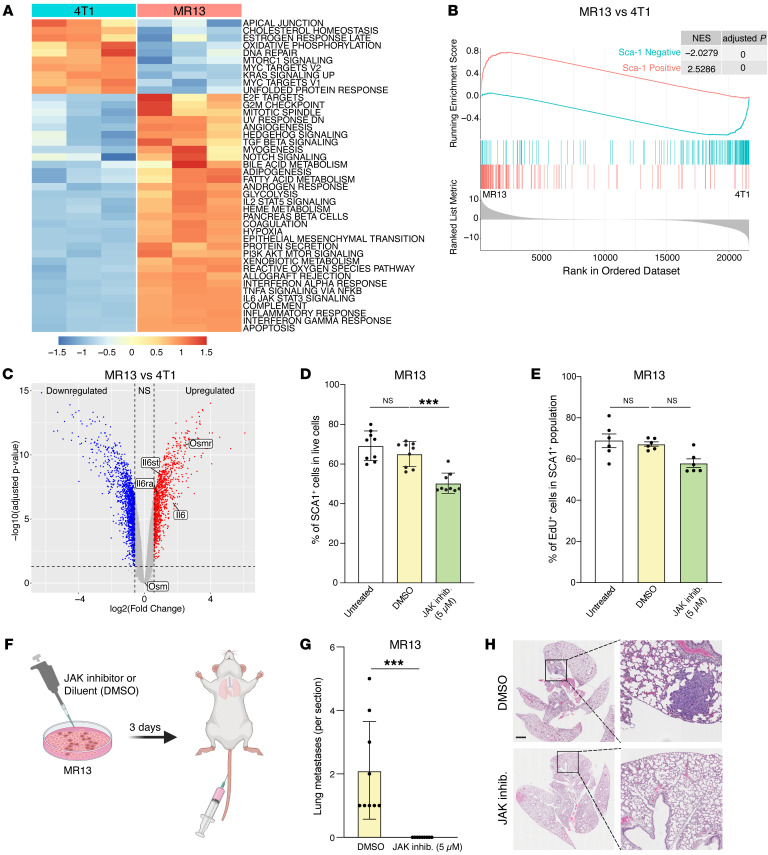
Figure 7. IL-6/JAK pathway promotes SCA1+ persistence and metastatic capacity in chemotherapy-resistant MR13 tumor cells.
(A and B) Gene expression analysis of parental 4T1 and chemotherapy-resistant MR13 cells. Heatmap represents the signature score of the hallmark pathways analysis. Results from 3 biological replicates are shown (A). GSEA results show that MR13 cells are positively enriched for the SCA1-positive signature and negatively enriched for the SCA1-negative signature (B). (C) Volcano plot showing the differential expression of Osm, Osmr, Il6st, Il6, and Il6ra mRNA in MR13 versus 4T1 tumor cells. (D) Fraction of SCA1+ population in MR13 tumor cells treated for 72 hours with the JAK inhibitor ruxolitinib (5 μM) relative to vehicle control (DMSO) treatment. n = 9/group. (E) Percentage of EdU-positive in SCA1+ population of MR13 cells after treatment with JAK inhibitor ruxolitinib or DMSO control for 72 hours. n = 6/group. (F) Schematic of the experimental design for testing the effect of ruxolitinib on MR13 lung metastatic capacity shown in G–H. MR13 tumor cells were treated with ruxolitinib (5 μM) or DMSO in vitro for 72 hours and then injected into the mouse tail vein. Lungs were examined for metastasis 10 days after tumor cell injection. (G and H) Quantification of lung metastases in mice injected i.v. with MR13 treated in vitro with ruxolitinib (5 μM) or DMSO (G). Representative images of H&E staining are shown (H). n = 8/group. Scale bar: 1 mm. Data are represented as means ± SEM and are representative of 3 independent experiments for D, E, and G. P values were calculated using 1-way ANOVA with Dunnett’s multiple-comparison test (D and E) or unpaired 2-tailed Student’s t test (G). ***P < 0.001.

