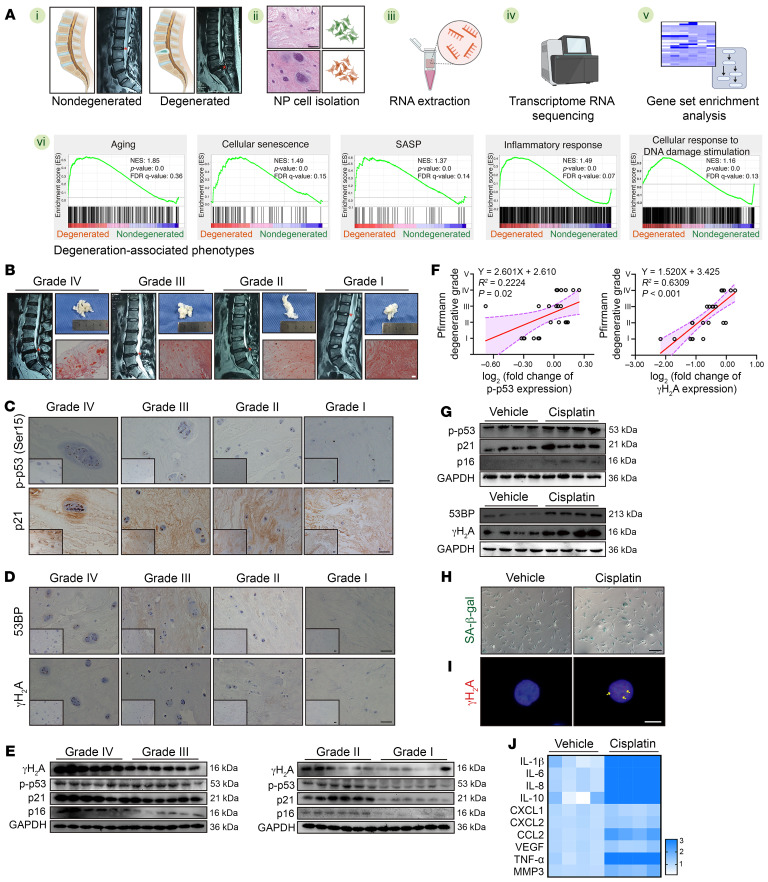
Figure 1. Aberrant genomic DNA damage promotes NP cell senescence during IVDD.
(A) Schematic workflow showing RNA-Seq and GSEA from human NP tissues (n = 6). (B) Representative MRIs, general views, and SO&FG staining of human NP tissues. Scale bar: 100 μm. (C) IHC staining of p-p53 and p21 in human NP tissues. Scale bars: 100 μm. (D) IHC staining of γH2A and 53BP in human NP tissues. Scale bars: 100 μm. (E) Representative Western blots showing expression of p-p53, p21, p16, and γH2A in human NP tissues (n = 24). (F) Correlation analysis between p-p53/γH2A and Pfirrmann degenerative grades (n = 24). (G) Representative Western blots showing expression of p-p53, p21, p16, γH2A, and 53BP in human NP cells treated with 50 μM cisplatin for 24 hours (n = 4 biological replicates). (H) Representative images of SA–β-gal staining of human NP cells. Scale bar: 100 μm. (I) IF staining of γH2A foci in human NP cells. Scale bar: 10 μm. (J) Heatmap of reverse transcription quantitative PCR (RT-qPCR) analysis showing the SASP in human NP cells (n = 4 biological replicates). At least 3 independent experiments were performed. Data are presented as the mean ± SEM. Simple linear regression analysis was performed in F.

