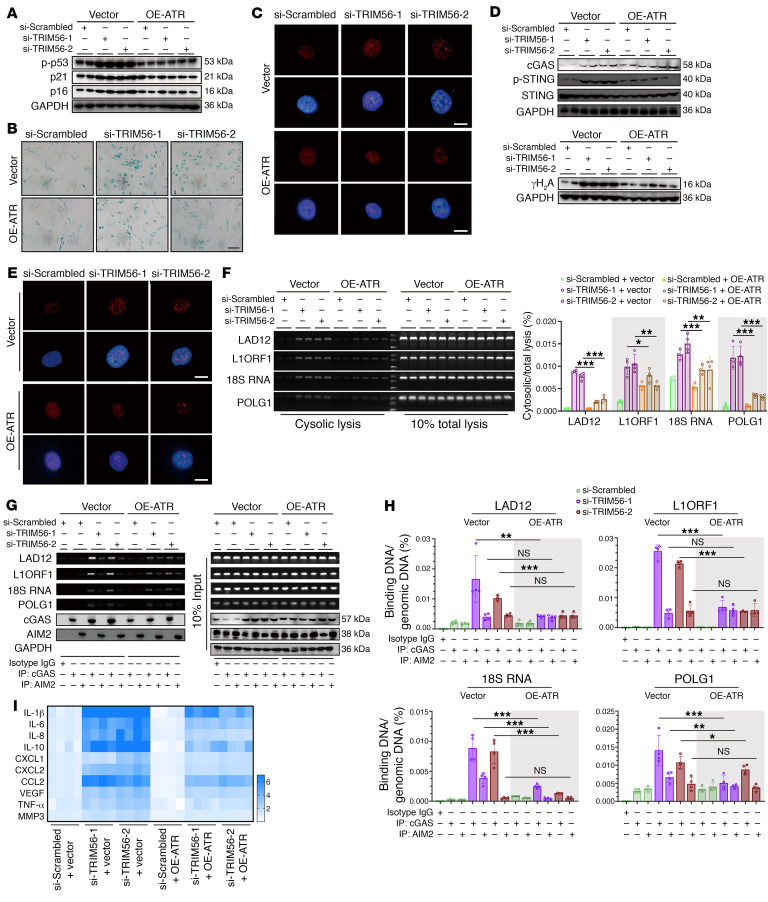
Figure 10. Loss of TRIM56 promotes ATR/cytoDNA/cGAS/STING axis–dependent NP cell senescence.
(A) Representative Western blots showing p-p53, p21, and p16 in TRIM56-silenced NP cells with or without ATR overexpression (n = 2 biological replicates). (B) Representative SA–β-gal staining in P2 NP cells with the indicated treatments. Scale bar: 100 μm. (C) Representative images of SAHFs in P2 NP cells with the indicated treatments. Scale bars: 10 μm. (D) Representative Western blots showing cGAS, STING, p-STING, and γH2A expression in P2 NP cells with the indicated treatments (n = 2 biological replicates). (E) IF staining of γH2A foci in P2 NP cells with the indicated treatments. Scale bars: 10 μm. (F) Ratio of cytosolic genomic DNA to total genomic DNA in P2 NP cells with the indicated treatments (n = 4 biological replicates). (G and H) DNA IP and ratio of genomic DNA binding with cGAS or AIM2 to total genomic DNA in P2 NP cells with the indicated treatments (n = 4 biological replicates). (I) Heatmap of differential SASP in P2 NP cells with the indicated treatments (n = 4 biological replicates). Data are presented as the mean ± SEM. At least 3 independent experiments were performed. *P < 0.05, **P < 0.01, and ***P < 0.001, by 2-way ANOVA (F and H).

