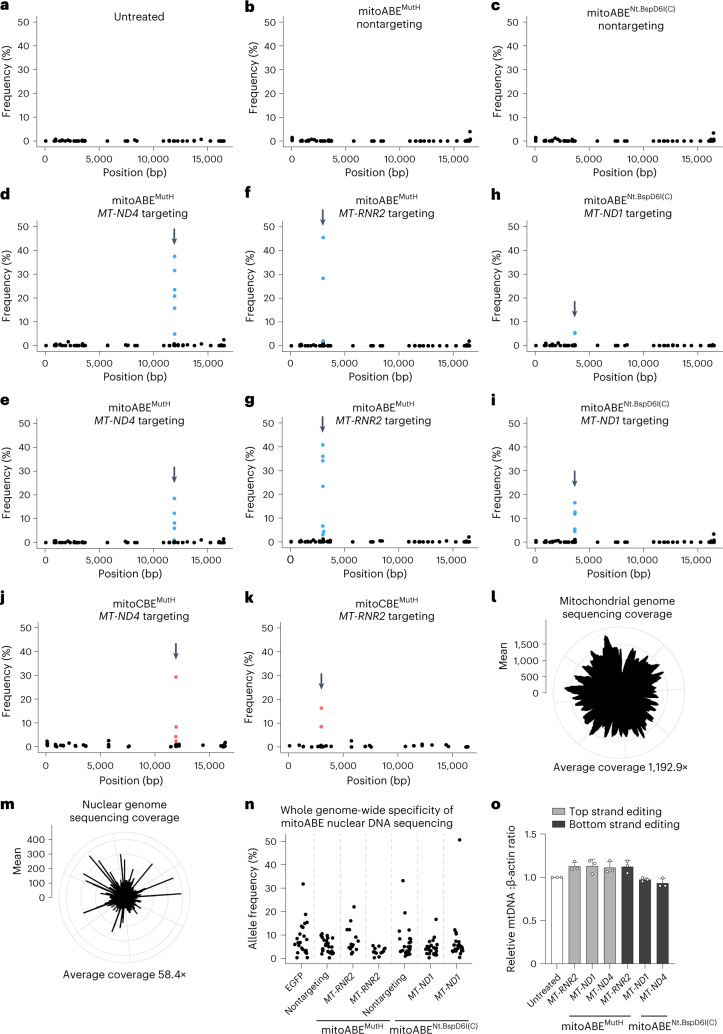
Fig. 5. Editing specificity of mitoBEs.
a–k, The average frequency and mitochondrial genome position of each unique single nucleotide variant are shown for untreated HEK293T cells (a) and HEK293T cells treated with nontargeting mitoABEMutH (b), nontargeting mitoABENt.BspD6I(C) (c), MT-ND4-targeting mitoABEMutH (left TALE–MutH with right TALE–TadA8e-V106W) (d), MT-ND4-targeting mitoABEMutH (left TALE–TadA8e-V106W with right TALE–MutH) (e), MT-RNR2-targeting mitoABEMutH (left TALE–MutH with right TALE–TadA8e-V106W) (f), MT-RNR2-targeting mitoABEMutH (left TALE–TadA8e-V106W with right TALE–MutH) (g), MT-ND1-targeting mitoABENt.BspD6I(C) (left TALE–Nt.BspD6I(C) with right TALE–TadA8e-V106W) (h), MT-ND1-targeting mitoABENt.BspD6I(C) (left TALE–TadA8e-V106W with right TALE–Nt.BspD6I(C)) (i), MT-ND4-targeting mitoCBEMutH (left TALE–rAPOBEC1–2×UGI with right TALE–MutH) (j) and MT-RNR2-targeting mitoCBEMutH (left TALE–MutH with right TALE–rAPOBEC1–2×UGI) (k). l,m, The deep sequencing average coverage of the mitochondrial genome (l) and nuclear genome (m). n, The nuclear genome average frequency of each unique single nucleotide variant are shown for the EGFP group (control), nontargeting groups and targeting groups. For a–k and n, all data are three or more biological replicates, the arrow points to the targeted editing site and the blue or red dots represent the editing efficiency of adenines or cytosines in the editing window. For l and m, all data are presented as mean values of n = 3 independent biological replicates. o, The copy number of mtDNA was detected by quantitative PCR. Data are presented as mean values ±s.d. of n = 3 independent biological replicates.

