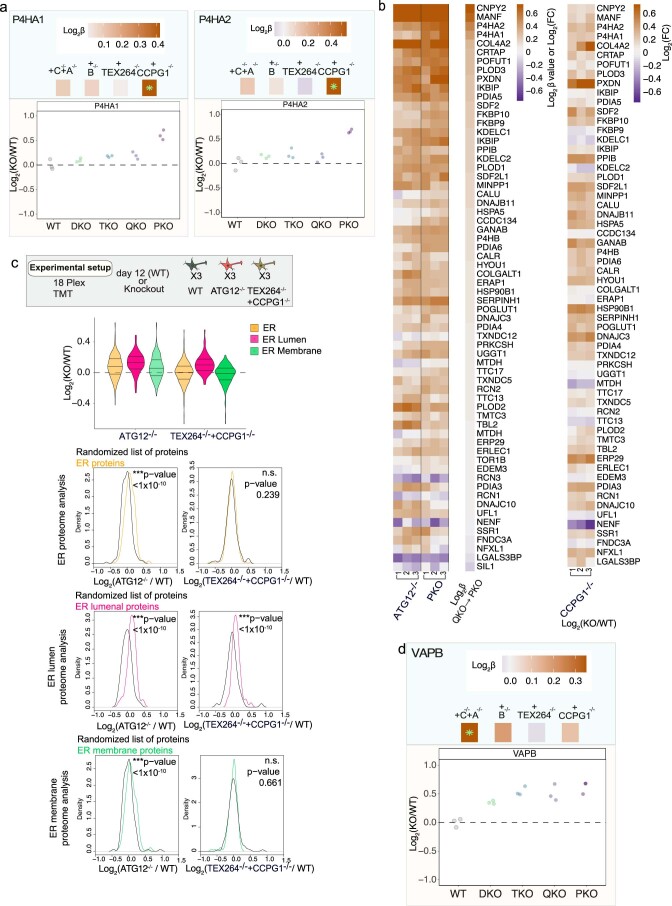
Extended Data Fig. 10. Differential regulation of ER membrane shaping proteins upon loss of ER-phagy receptors.
a, ER lumenal proteins that accumulate with additional ER-phagy receptor knockout. Top panels are β coefficient values and lower panels are Log2FC; green asterisks in β coefficient for single protein heatmaps indicate significant change (adjusted p-value < 0.05) in β coefficient. b, ER lumenal protein heatmaps reflecting the change in abundance (Log2FC) for deletion of ATG12 or PKO, reflecting β coefficient values for QKO to PKO, (left panel) or reflecting the change in abundance (Log2FC) for single deletion of CCPG1 (right panel). c, Experimental scheme for multiplexed total proteome analysis of WT, ATG12−/− or TEX264−/−/CCPG1−/− iNeurons (n = 3) and violin plots for total ER, ER-lumen, and ER-membrane proteins derived from this analysis. Violin plots from a TMT 18-plex experiment comparing WT, ATG12−/−, and another ER-phagy receptor allelic combination (TEX264−/− +CCPG1−/−) with complementary comparisons of Log2FC (mutant/WT) distributions of ER proteins (top), ER lumenal proteins (middle), or ER membrane proteins (bottom) to distributions of randomized selections of the same number of proteins (100 iterations). p-values for each comparison are calculated with a Kolmogorov–Smirnov Test (two-sided) test. Together these reflect accumulation of the ER, ER lumen and ER membrane for Log2FC (ATG12−/−/WT) but only the ER lumenal proteome accumulates for Log2FC (TEX264−/− +CCPG1−/− /WT). d, ER contact site protein VAPB accumulates with additional ER-phagy receptor knockout. Plot is annotated as in panel a.

