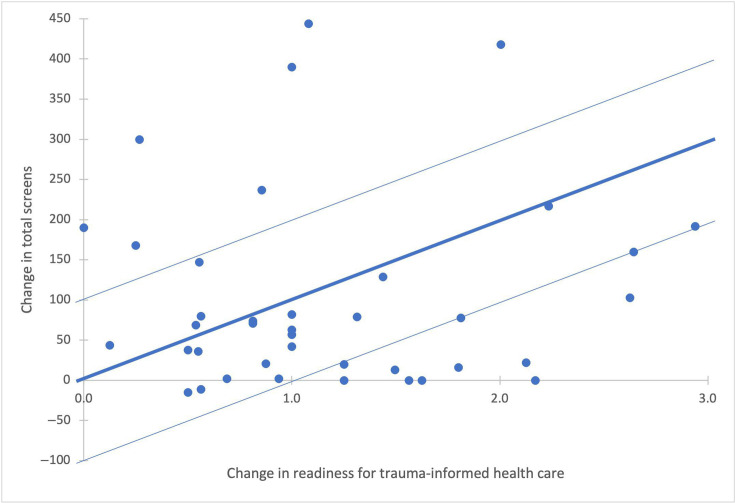
Figure 5:
Association between change in readiness for TIHC and change in screens per quarter between baseline and follow-up (includes 95% confidence intervals for estimates). Note: dots represent observed values of change in screening and TIHC index for each site. The lines represent the estimated association between changes in TIHC index and total screens. These estimates are based on a hierarchical linear model that accounts for nesting of clinics within organizations. Dark line represents model estimate. Light lines represent the 95% confidence interval. One site with an increase of 1125 total screens (9 times the average change and 2.5 times the next-highest change) is dropped from the figure and the estimated association because this outlier made it hard to depict the main findings. TIHC = trauma-informed health care.

