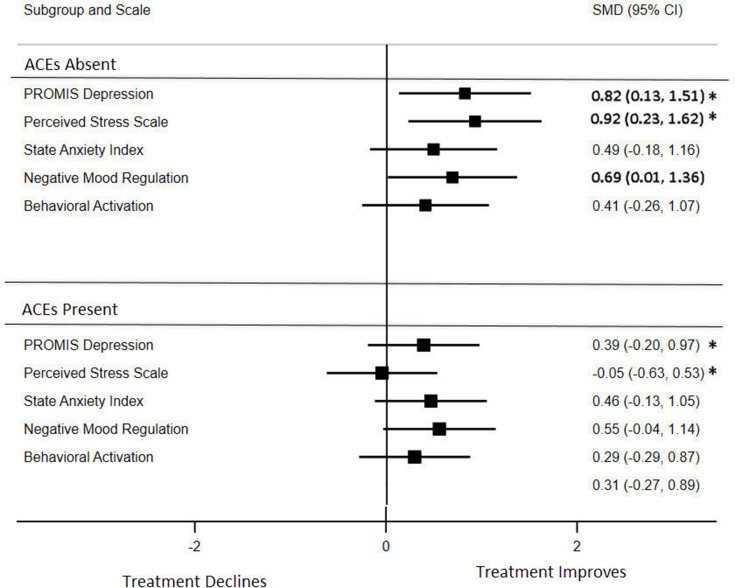
Figure 1:
Forest plot of the standardized mean difference of the effect size in the slopes between the intervention and control groups for participants with an absence or presence of ACEs. Effect size differences for depression, perceived stress, and anxiety were reversed from negative to positive to demonstrate improvement, ensuring that all of the scales were pointing in the same direction. The between-group statistical significance is indicated in bold, whereas the differential effect between ACEs absence vs presence for depressive symptoms and perceived stress is indicated with an asterisk. ACE = Adverse Childhood Experience; CI = confidence interval; PROMIS = Patient-Reported Outcomes Measurement Information System; SMD = standardized mean differences.

