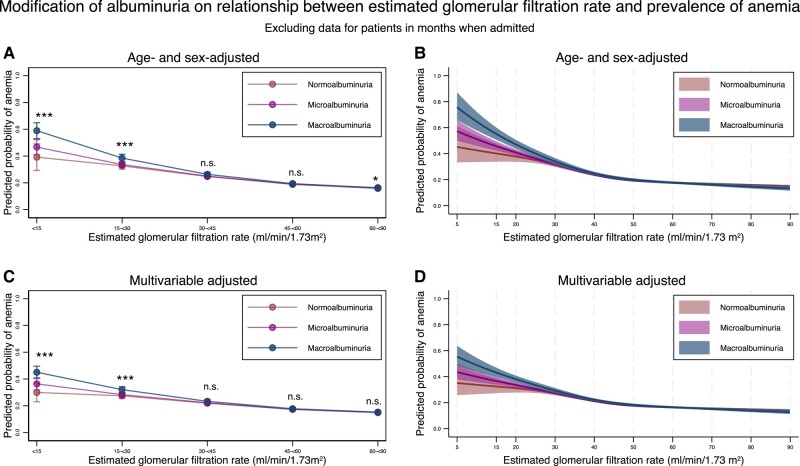
Figure 12.
Predicted probability of anemia stratified by the severity of albuminuria using categorical classifications and nonlinear change of estimated glomerular filtration rate with 95% confidence intervals when excluding data for individuals in months when they were admitted. (A) Predicted probability of anemia after adjustment for age and sex stratified by the categories for estimated glomerular filtration rate based on the severity of albuminuria. (B) Predicted probability of anemia after adjustment for age and sex along with nonlinear estimated glomerular filtration rate based on the severity of albuminuria. (C) Predicted probability of anemia after adjustment for age, sex, comorbidities, and medications stratified by the categories for estimated glomerular filtration rate based on the severity of albuminuria. (D) Predicted probability of anemia after adjustment for age, sex, comorbidities, and medications, along with nonlinear estimated glomerular filtration rate based on the severity of albuminuria. * P-value < .05, ** P-value < .01, *** P-value < .001, n.s., not statistically significant. All data are expressed point estimates with a 95% confidence interval. Differences in estimated glomerular filtration rate among the same estimated glomerular filtration rate category were controlled in both models.

