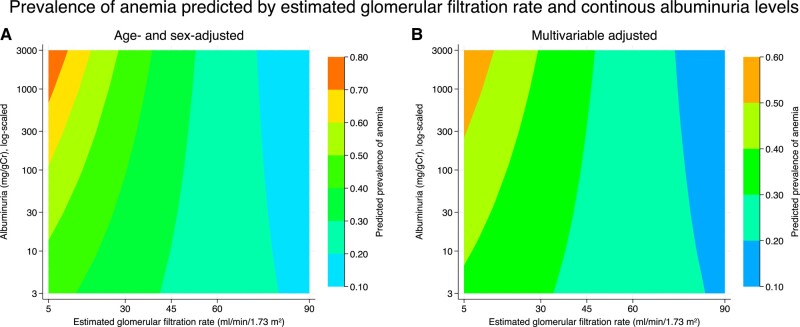
Figure 9.
Prevalence of anemia predicted by continuous albuminuria levels and estimated glomerular filtration rate using contour plots. (A) Predicted probability of anemia after adjustment for age, sex. (B) Predicted probability of anemia after adjustment for age, sex, comorbidities, and medications.

