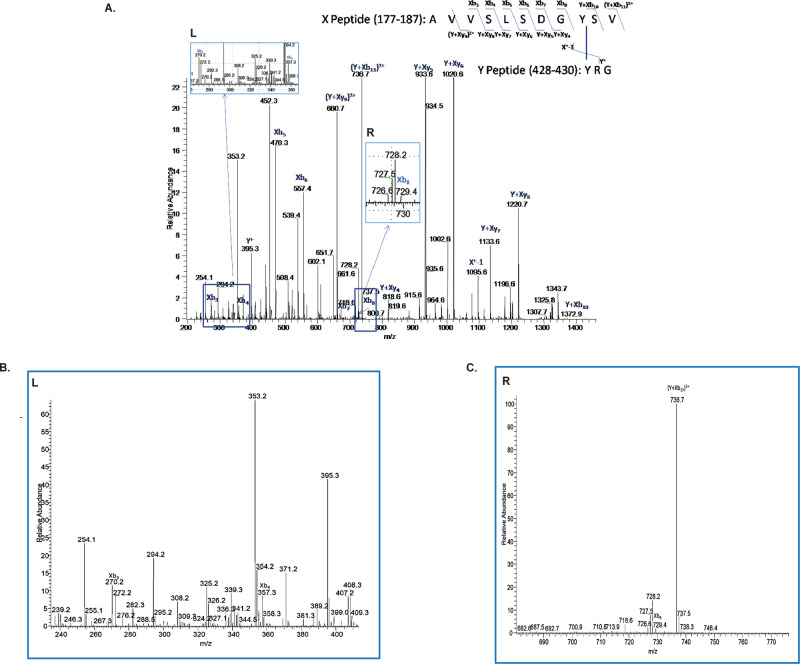
Fig. 3. Tyrosine modification analysis of DT-preF using NanoLC-ESI-MS/MS.
A MS/MS spectrum of conjugated peptide indicating a Y-Y linkage (Y185-Y428) between the ‘X’ peptide (AVVSLSDGYSV 177–187) and ‘Y’ peptide (YRG 428–430) following digestion of the glycoprotein with trypsin, chymotrypsin, and pepsin. The ion series is indicated at the top right of the figure, while the mass spectrum is beneath with the ion series labeled. B Zoomed in view of the Left (L) insert (C) Zoomed in view of the Right (R) insert. Mass spectrometry analysis to find crosslinked species was performed a single time due to 98.5% coverage of the protein.

