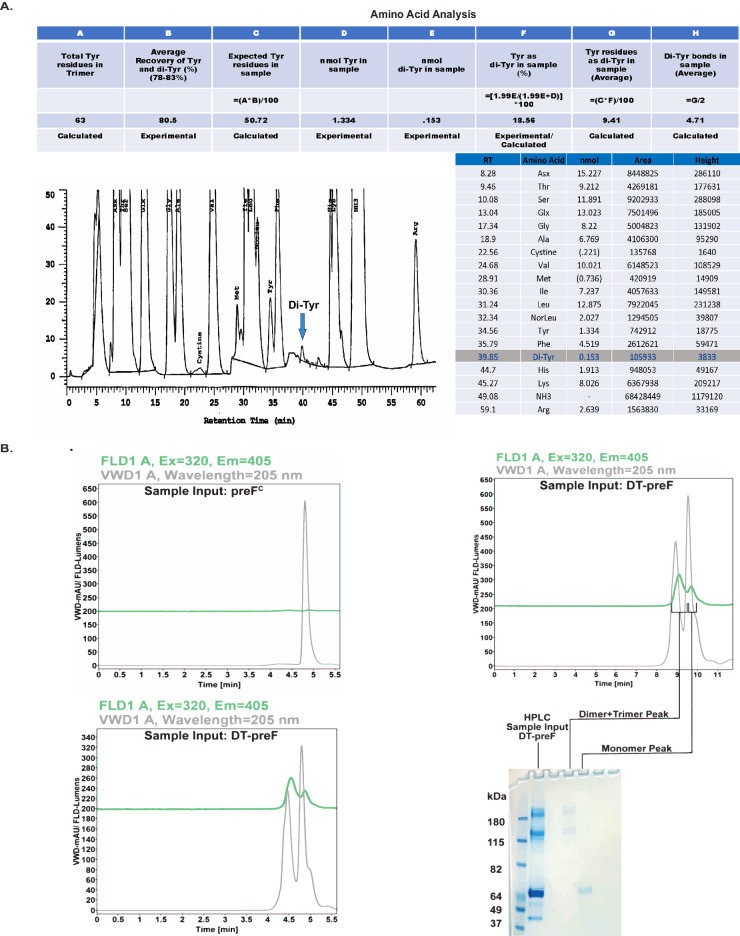
Fig. 4. Biochemical/biophysical characterization of the DT-preF molecule.
A Amino acid analysis of DT-preF. Samples were acid-hydrolyzed and analyzed for amino acid content using a Concise AminoSep Beckman Style Na+ column and a Hitachi analytical HPLC. Table (top) with calculated Dityrosine (Di-Tyr) bonds in the DT-preF sample utilizing the experimentally determined percentage recovery and quantification information. Chromatogram (bottom left) indicating the detection of the dityrosine peak in the DT-preF sample. Table (bottom right) indicating list of amino acids detected in the analysis with the respective peak attributes/quantification. Amino acid analysis was performed a single time. B Chromatograms of uncrosslinked F protein containing the DT mutations, preFC (top left) and DT-preF (bottom left) showing fluorescence (green) and UV (gray) traces at increasing retention times (min) following separation using analytical size exclusion chromatography under reducing and denaturing conditions. Chromatogram showing fluorescence (green) and UV (gray) traces of DT-preF (top right) and its corresponding SDS-PAGE analysis gel (bottom right) indicating separation of the dimer/trimer peak from the monomer peak, as indicated. This separation between multimers and monomers observed on SDS-PAGE analysis gels has been observed and reproduced in >3 independent experiments.

