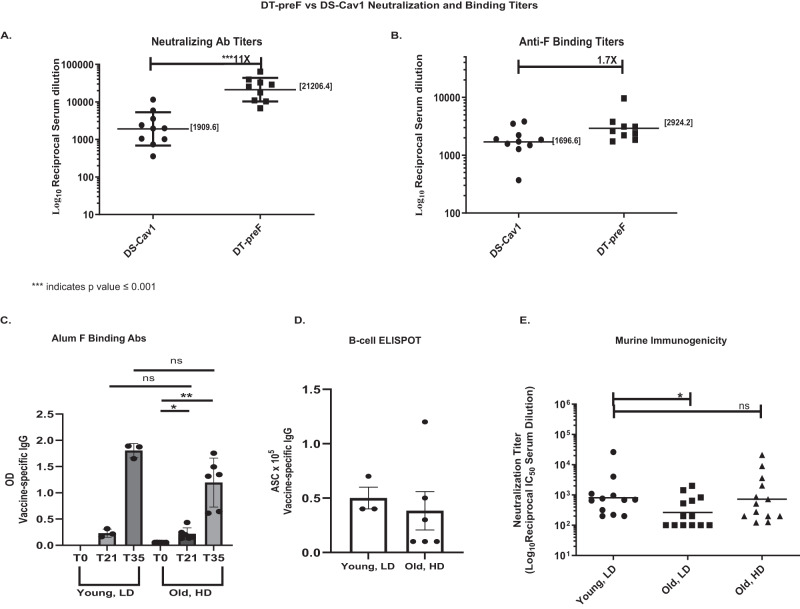
Fig. 6. DT-preF is a highly potent immunogen in mice.
A Mouse serum neutralization titers were measured by Renilla Luciferase assay after vaccination with 2.3 µg of the indicated immunogens formulated on Alhydrogel to compare potency of DT-preF and DS-Cav1. The reciprocal of the IC50 neutralizing antibody titers are graphed as dot plots. Geometric mean titers are graphed and the numerical value is specified on the graph as a bar. Error bars represent the geometric SD. Groups of animals were compared on the distribution of the outcome using the Mann-Whitney test with a p value of 0.0002. Sample size ‘n’ to derive statistics = 10, 15-week-old, female CB6F1/J mice/group; assays were run in duplicate. B Anti prefusion F binding titers were measured by ELISA using the serum obtained in (A) and prefusion F as the capture antigen. The EC50’s were plotted as dot plots with the geometric mean titers graphed, represented as a bar and the numerical value is specified on the graph. Sample size ‘n’ to derive statistics = 10,15-week-old, female CB6F1/J/ group; assays were run in duplicate. C Young (4 months) and old (17 months) female, BALB/c mice were immunized with our DT-preF immunogen on alum at a low dose (LD; 10 µg) and a high dose (HD; 45 µg), respectively. Anti- preF antibody responses were quantified from serum samples collected on day 0 (pre-bleed), day 21 (prime only), and day 35 (prime-boost) by ELISA-based assay and plotted as bar graphs with the individual titers indicated by dots. Mean comparisons were performed by a 2-tailed paired (within group) or unpaired (between groups) Student’s t test using GraphPad Prism software. Error bars represent the SEM. p values of 1 and 2 star significances are p = 0.0186 and p = 0.0019, respectively. D B-cell responses were measured for young, low dose and old, high dose vaccination groups by measuring vaccine-specific IgGs in antibody secreting cells (ASC) using a CTL ELISpot scanner. The mean data is shown as a bar graph with error bars to indicate the SEM. Mean comparisons were performed by a 2-tailed paired Student’s t test using GraphPad Prism software, but were not significant. The F Binding and ELISPOT analysis was performed at an earlier timepoint after three young and six aged biologically independent animal data had been accumulated. E Serum from day 35 (prime-boost) was used to determine neutralizing antibody titers using a luminescence-based microneutralization assay. Dot plots of neutralizing antibody titers, expressed as the reciprocal of the IC50 serum dilution with geometric means graphed and indicated as bars, were used to compare young, low dose vaccination vs old, low dose and old, high dose vaccinations. Statistical analysis was performed using a two-sample t-test (p = 0.041). Neutralization assays were run on duplicate plates and averaged prior to IC50 calculation with 4-month-old (young) and 17-month-old (old) male and female Balb/c mice totaling 12 or 13 biologically independent animals per group. For (A) to (E), source data are provided as a Source Data file.

