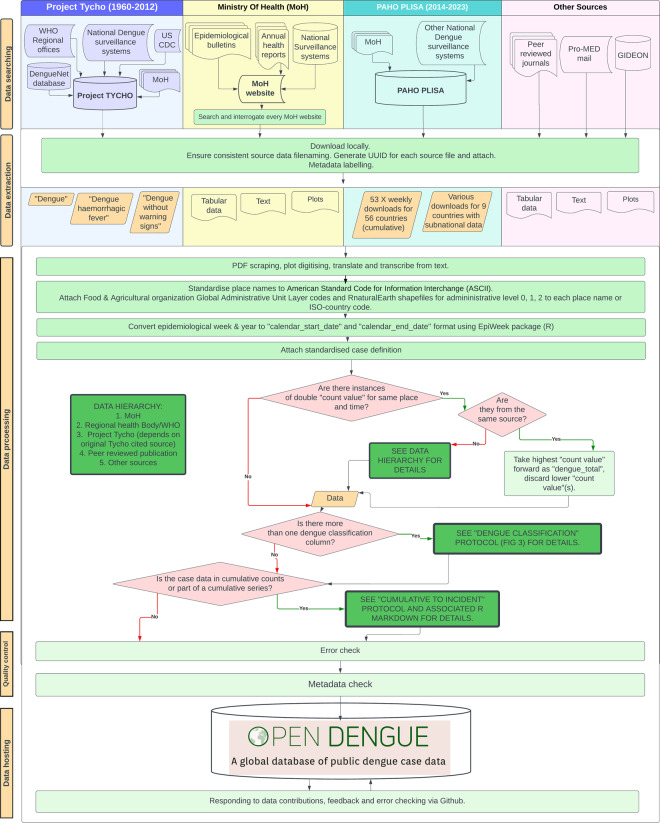
Fig. 1.
Detailed schematic of OpenDengue methods through data searching, extraction, processing, quality control and hosting. Columns have coloured backgrounds according to the original source category, including Project Tycho, Ministry of Health, PAHO PLISA and other sources. Coloured columns contain methods applied only to that specific source. White background contains methods applied to data from all source categories. Emboldened green boxes lead to more detailed protocols included in this publication. Red diamonds represent decision trees. Light green rectangles represent standardised processes. Orange rhombus represents data. Figure source: OpenDengue.org.

