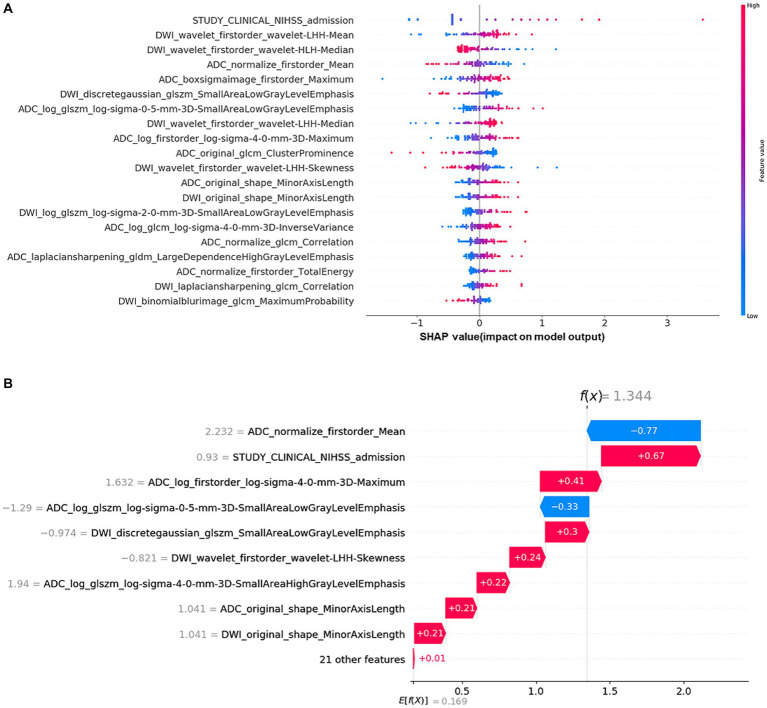
Figure 5.
Shapley additive explanation (SHAP) diagram of variable contributions for the optimal (combining-all) predictive model: (A) The relative contributions of RA features and multi-clinical variables for long-term prognosis prediction. The color intensity of the graph revealed a discernible pattern: an increment in the NIHSS admission score corresponded to an escalating probability of a poor outcome. For the DWI_Wavelet_firstorder_wavelet-lhh-mean feature, the lower the value of the feature, the higher likelihood of a poor outcome. (B) SHAP values of a typical patient from the positive group (poor outcome), illustrated with the important variables.

