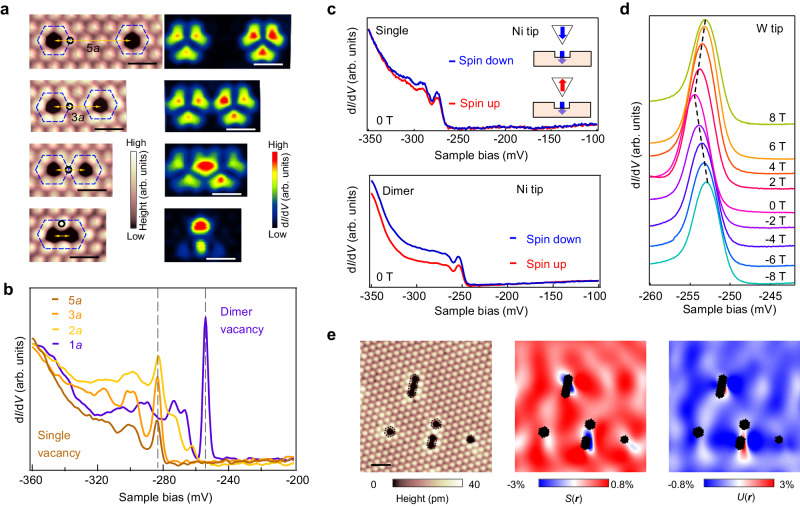
Fig. 2. Evolution of vacancy bound states with the spacings of two neighboring S vacancies.
a, Series of STM images, showing that two spatially-separated single S vacancies gradually merge into a dimer vacancy (Vs = −400 mV, It = 500 pA, Vmod = 0.2 mV). b The dI/dV spectra obtained at a single vacancy of (a), showing the suppression of bound states as another vacancy approaches closer and emergence of new bound states for the dimer vacancy (Vs = −360 mV, It = 500 pA). The black dashed lines mark the energy position of bound states. The spatial positions for collecting dI/dV spectra are marked by the black circles at each STM topographic image. c Spin–polarized dI/dV spectra in the vicinity of single vacancy and dimer vacancy, showing a spin-down majority for both vacancies (Vs = −350 mV, It = 500 pA). Inset: schematics showing the magnetization of tip and the vacancy bound state. We define the spin direction as “up” and “down” with respect to cleaved S surfaces. d The dI/dV spectra of the bound states in a magnetic field perpendicular to the sample surface from −8 T to 8 T, showing a linear shift toward higher energy independent of the magnetic field direction (Vs = −300 mV, It = 2 nA, Vmod = 0.1 mV). e Strain analysis of the S vacancies. The Symmetric strain maps S(r)≡uaa(r)+ubb(r) (middle panel) and antisymmetric strain map U(r)≡uaa(r)-ubb(r)(right panel) are derived from STM topography (left panel), showing that the lattice distorts around the vacancies. The vacancy regions are overlaid by black hexagons as there are no strains inside vacancies. The scale bars in (a) and (e) correspond to 1 nm.

