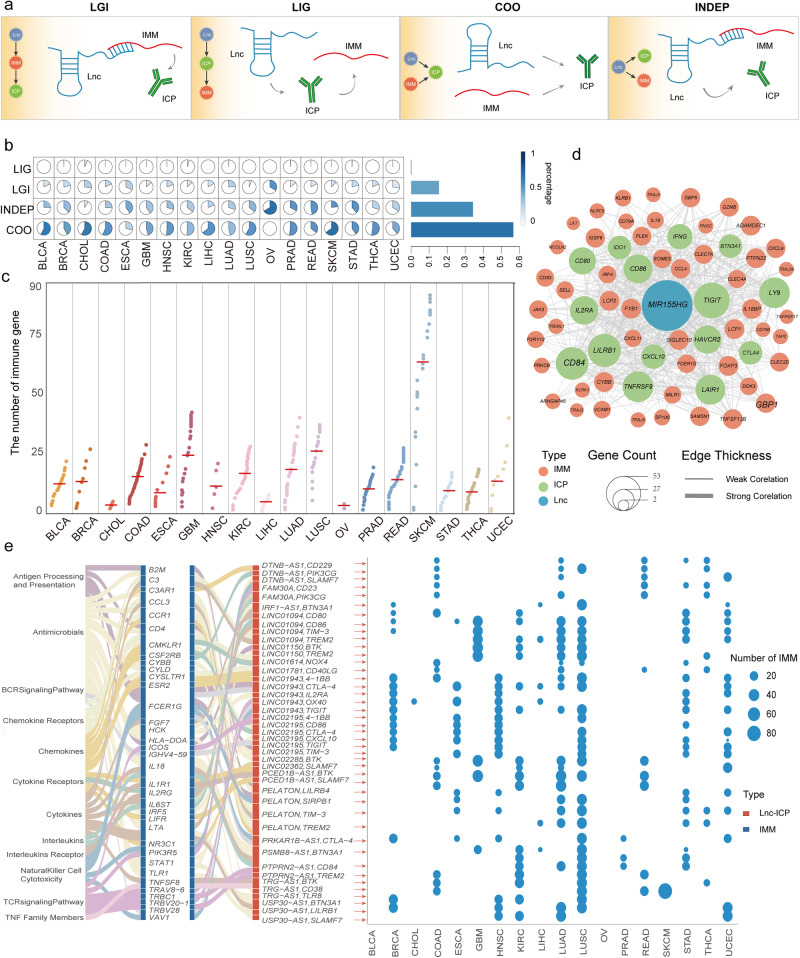
Fig. 2. ICP-LncCRCTs have complex regulatory mechanisms.
a Four possible regulatory patterns. b The proportions of the four regulatory patterns in all cancers. c The numbers of immune genes comprising ICP-LncCRCTs in each cancer type. Different colors indicate different types of cancer. The red horizontal line indicates the mean value. d Subnetwork of ICP-LncCRCTs, including MIR155HG. Red, green, and blue indicate the immune gene, ICP gene, and lncRNA, respectively. The size of the nodes indicates the number of connected nodes. The thickness of the edges indicates the level of correlation. e The same lncRNA-ICP gene pair can interact with different ICP-LncCRCTs via different immune genes involved in diverse immune pathways. The blue bubble diagram indicates the number of immune genes affected by each lncRNA-ICP gene pair in each cancer. A Sankey diagram indicated that each lncRNA-ICP gene pair participates in different immune pathways by mediating different immune genes. The first column of the Sankey diagram indicates the different immune pathways, and the second column indicates the immune genes. The third column indicates the lncRNA-ICP gene pairs.

