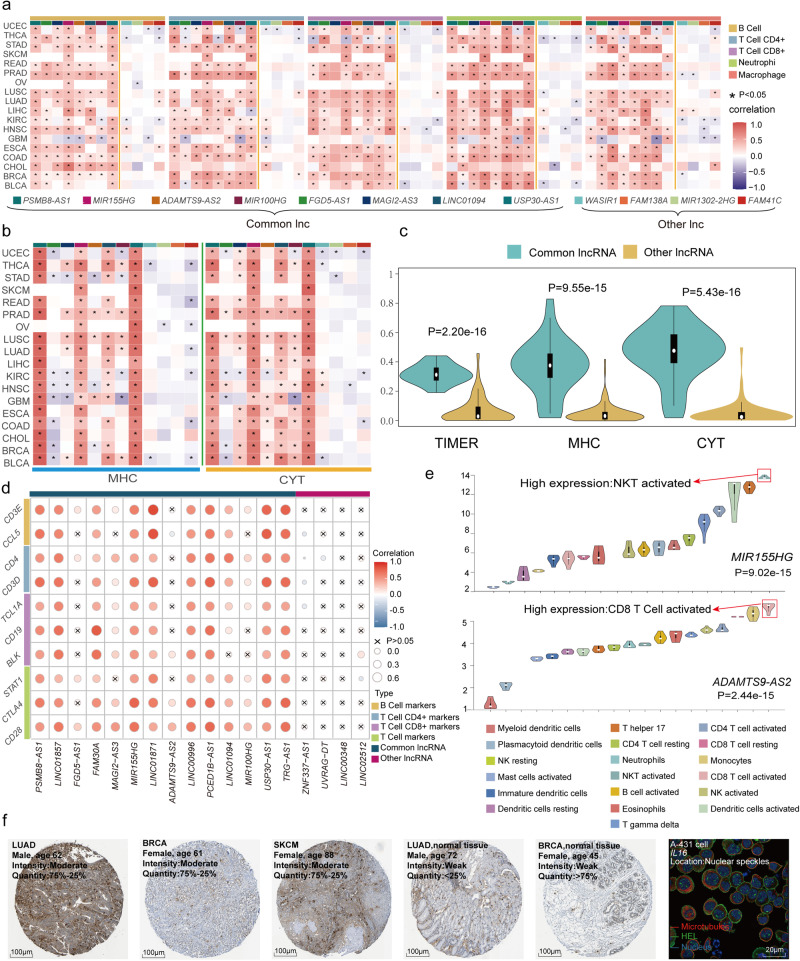
Fig. 4. Relationship between ICP-related lncRNAs and immune system activity.
a Heatmap showing the correlation of 18 common lncRNAs and specific lncRNAs with TIMER scores. “*” indicates a strong correlation. b Heatmap representing the correlation of common lncRNAs and specific lncRNAs with the MHC score and CYT score. c Violin plots representing the overall comparison of common lncRNAs and specific lncRNAs with MHC scores and CYT scores. Black boxes indicate the interquartile range of the data. White dots indicate the median. Black vertical lines indicate 95% confidence intervals. The width of the violin plot indicates the density of the data. d Correlations between common lncRNAs and specific lncRNAs and markers of four classes of immune cells. The size of the circle and the shade of the color indicate the magnitude of the correlation. “x” indicates no correlation (P > 0.05, Pearson correlation analysis). e Violin plots indicating the differential expression of MIR155HG and ADAMTS9-AS2 in 19 immune cell lines (Kruskal‒Wallis test; p values are displayed at the bottom of the plots). Black boxes indicate the interquartile range of the data. White dots indicate the median. Black vertical lines indicate 95% confidence intervals. The width of the violin plot indicates the density of the data. f Immunohistochemistry (IHC) staining of C3AR1 in LUAD, BRCA, and SKCM tissues. Immunofluorescence (IF) staining of IL16 in A-431 cells.

