
Fig. 6. Comparison between Osteoblast count per photomicrograph in the study and control groups after 4 and 8 weeks with 95% confidence interval.
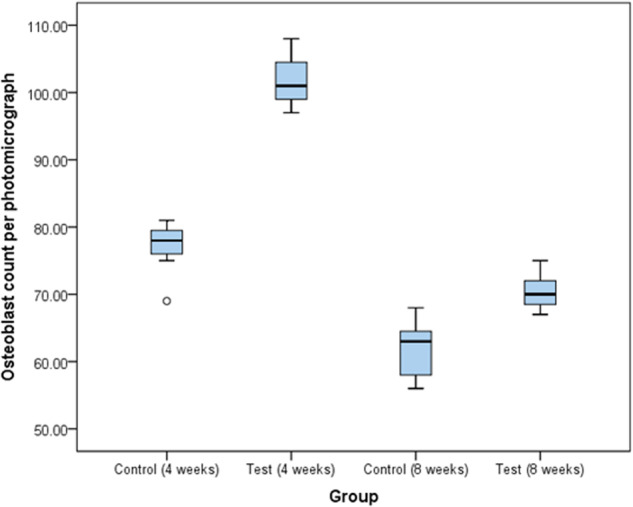
The figure shows that the range of number of osteoblasts per photomicrograph for the control group after 1-month ranges from 69 to 81 with a mean of 77 osteoblasts while the number of osteoblasts per photomicrograph for the test group after 1 month ranged from 97 to 108 with a mean of 101.86. After 2 months, the number of osteoblasts per photomicrograph for the control group ranged from 56 to 68 with a mean of 61.71 while for the test group it ranged from 67 to 75 with a mean of 70.43 osteoblasts per photomicrograph.