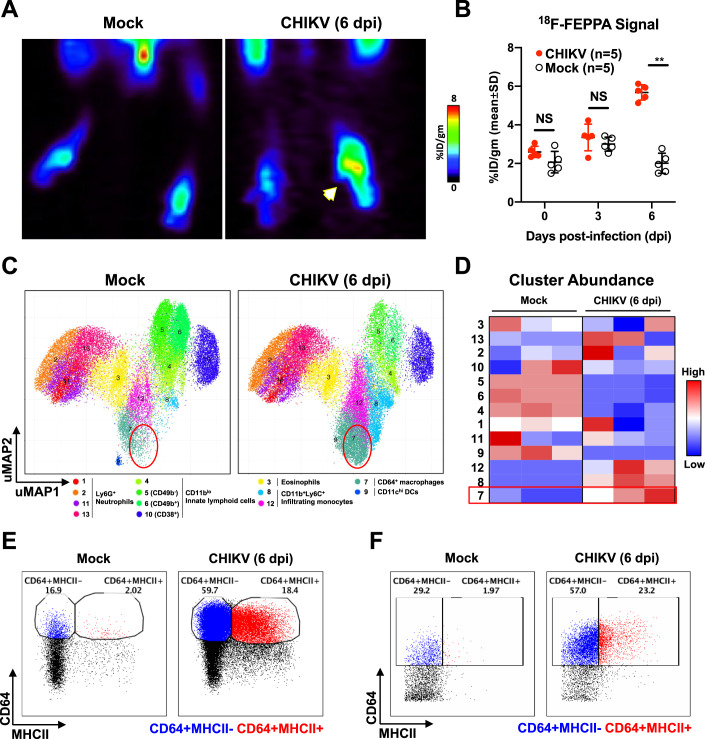
Figure 1. Upregulation of CD64+ macrophages during CHIKV infection identified by high-dimensional analysis of mass cytometry data.
(A) Representative PET/CT images of mock-infected and CHIKV-infected joints at 6 days post-infection (dpi) following intravenous injection of 18F-FEPPA radioligand to track infiltration of activated macrophages. Amount of [18F]FEPPA uptake was measured in the paw area and represented as a percentage of the administered dose per gram of tissue in the ROI (%ID/gm). White arrow indicates CHIKV-infected joint. (B) Radioactive signal from mock and CHIKV-infected joint-footpads was quantified. Data were from biological replicates and presented as mean ± SD. Statistical analysis was performed using non-parametric Mann–Whitney U test (two-tailed; **P = 0.0079). (C,D) Joint-footpad cells from CHIKV-infected and non-infected animals (n = 3 per group) were harvested at 6 dpi and stained with a panel of antibodies targeting myeloid cell surface markers. Acquisition was performed with CyTOF and data were analyzed with dimension reduction technique Uniform Manifold Approximation and Projection (UMAP). Superimposed PhenoGraphs of UMAP transformed CyTOF data from mock and CHIKV-infected joints. Presence of cluster 7 as enclosed by red circle (C). Cluster ID annotation with heatmap. Cluster IDs are indicated in rows, while groups are indicated in the columns. The color represents the Z-score transformed median number of cells in the clusters, which are grouped in phenotypic proximity based on surface marker similarities. Red rectangle highlights the difference of cluster 7 between CHIKV and mock-infected joints (D). (E,F) Manual gating of CD64+MHCII- (blue) and CD64+MHCII+ (red) macrophages on live CD45+CD11b+Ly6C+Ly6G- monocytes using data obtained from either fluorescence-based flow cytometry (E) or CyTOF (F). Source data are available online for this figure.

