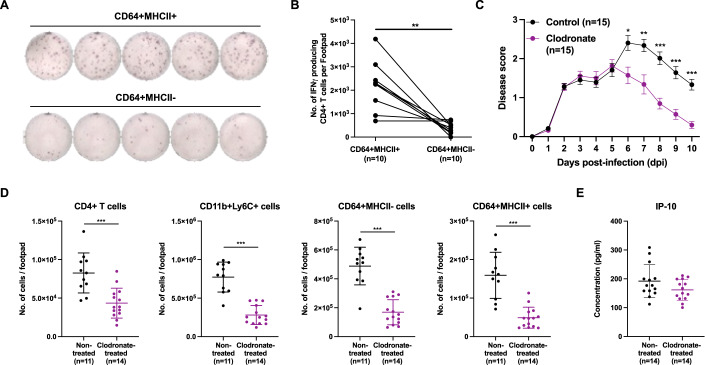
Figure 6. Crosstalk between CD64+MHCII+ macrophages and CD4+ T cells drive CHIKV pathogenesis.
(A,B) CD64+MHCII+ and CD64+MHCII- macrophages were sorted and CHIKV-specific CD4+ T cells were isolated from joint-footpad of CHIKV-infected animals at 6 dpi. CHIKV-specific CD4+ T cells were subsequently restimulated with CHIKV antigen in the presence of either CD64+MHCII+ or CD64+MHCII- macrophages for 18 h. Representative ELISpot images from 5 animals per group are shown (A). Paired line graph showing the numbers of IFNγ-producing CHIKV-specific CD4+ T cells post-re-stimulation (B). Data were from biological replicates obtained from two independent experiments and comparison was performed with non-parametric Wilcoxon matched-pairs signed rank test (two-tailed; **P = 0.0078). (C) Wild-type animals were infected with 1 × 10⁶ PFU of CHIKV in the right footpad. At 5 dpi, animals were given intraperitoneally with either clodronate liposome (1 mg) or empty liposome (control). Joint-footpad swelling of these animals were monitored over a period of 10 days. Data were from biological replicates obtained from two independent experiments and presented as mean ± SD. Data comparison between groups was performed with non-parametric Mann–Whitney U test (two-tailed). 6 dpi, *P = 0.0102; 7 dpi, **P = 0.0051; 8 dpi, ***P = 0.0000551; 9 dpi, ***P = 0.0000535; 10 dpi, ***P = 0.00000135. (D,E) Wild-type animals were infected with 1 × 10⁶ PFU of CHIKV in the right footpad. At 5 dpi, animals were given intraperitoneally with either clodronate liposome (1 mg) or empty liposome (control). Immunophenotyping was performed at 6 dpi for both groups of animals. Graphs show the numbers of CD4+ T cells, CD11b+Ly6C+ precursor cells, CD64+MHCII- and CD64+MHCII+ macrophages present in the joint-footpad (D). Levels of IP-10 present in joint-footpad was quantified at 6 dpi from another set of animals (E). Data were from biological replicates obtained from two independent experiments and presented as mean ± SD. Data comparisons between the groups were performed with non-parametric Mann–Whitney U test (two-tailed). CD4+ T, ***P = 0.0005; CD11b+Ly6C+, ***P = 0.00000538; CD64+MHCII-, ***P = 0.00000538; CD64+MHCII+, ***P = 0.00000853. Source data are available online for this figure.

