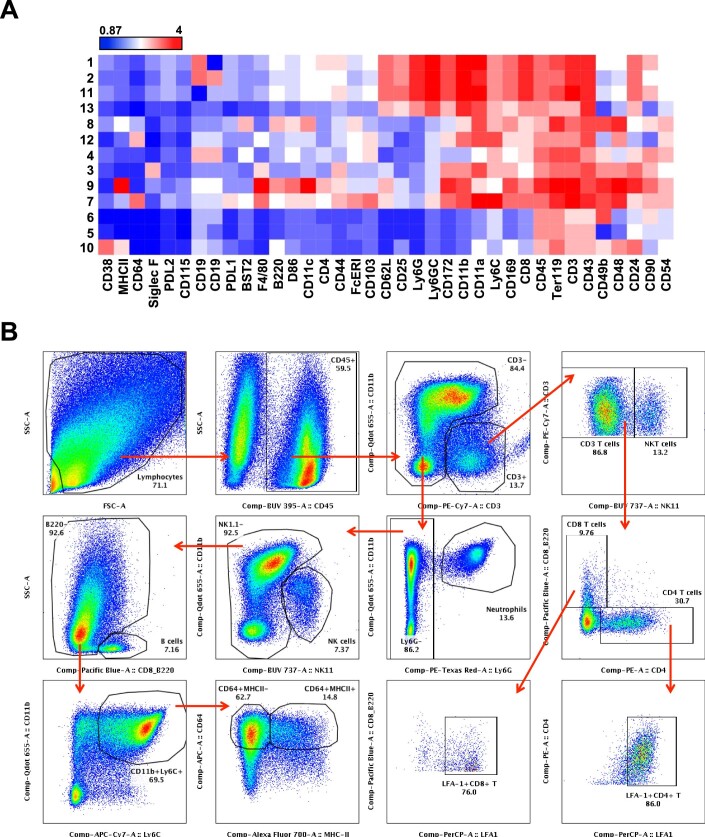
Figure EV1. High-dimensional analysis of mass cytometry data and Immunophenotyping gating strategy.
(A) Cluster ID annotation with heatmap. Cluster IDs are indicated in rows, while surface marker expression levels are indicated by the columns. The color represents the relative mean signal intensity of a surface marker. Blue and red represent low and high intensity, respectively. (B) Cellular infiltrates in the CHIKV-infected joint-footpad at 6 days post-infection (dpi) were determined with flow cytometry. Brieftly, live CD45+ immune cells were gated out before the CD3+ (inclusive of CD4+ and CD8+) T cells, CD3+NK1.1+ NKT cells, CD11b+Ly6G+ neutrophils, NK1.1+ NK cells, CD11b+Ly6C+ monocytes and CD64+ macrophages were identified. Plots shown are representative of a single CHIKV-infected mouse.

