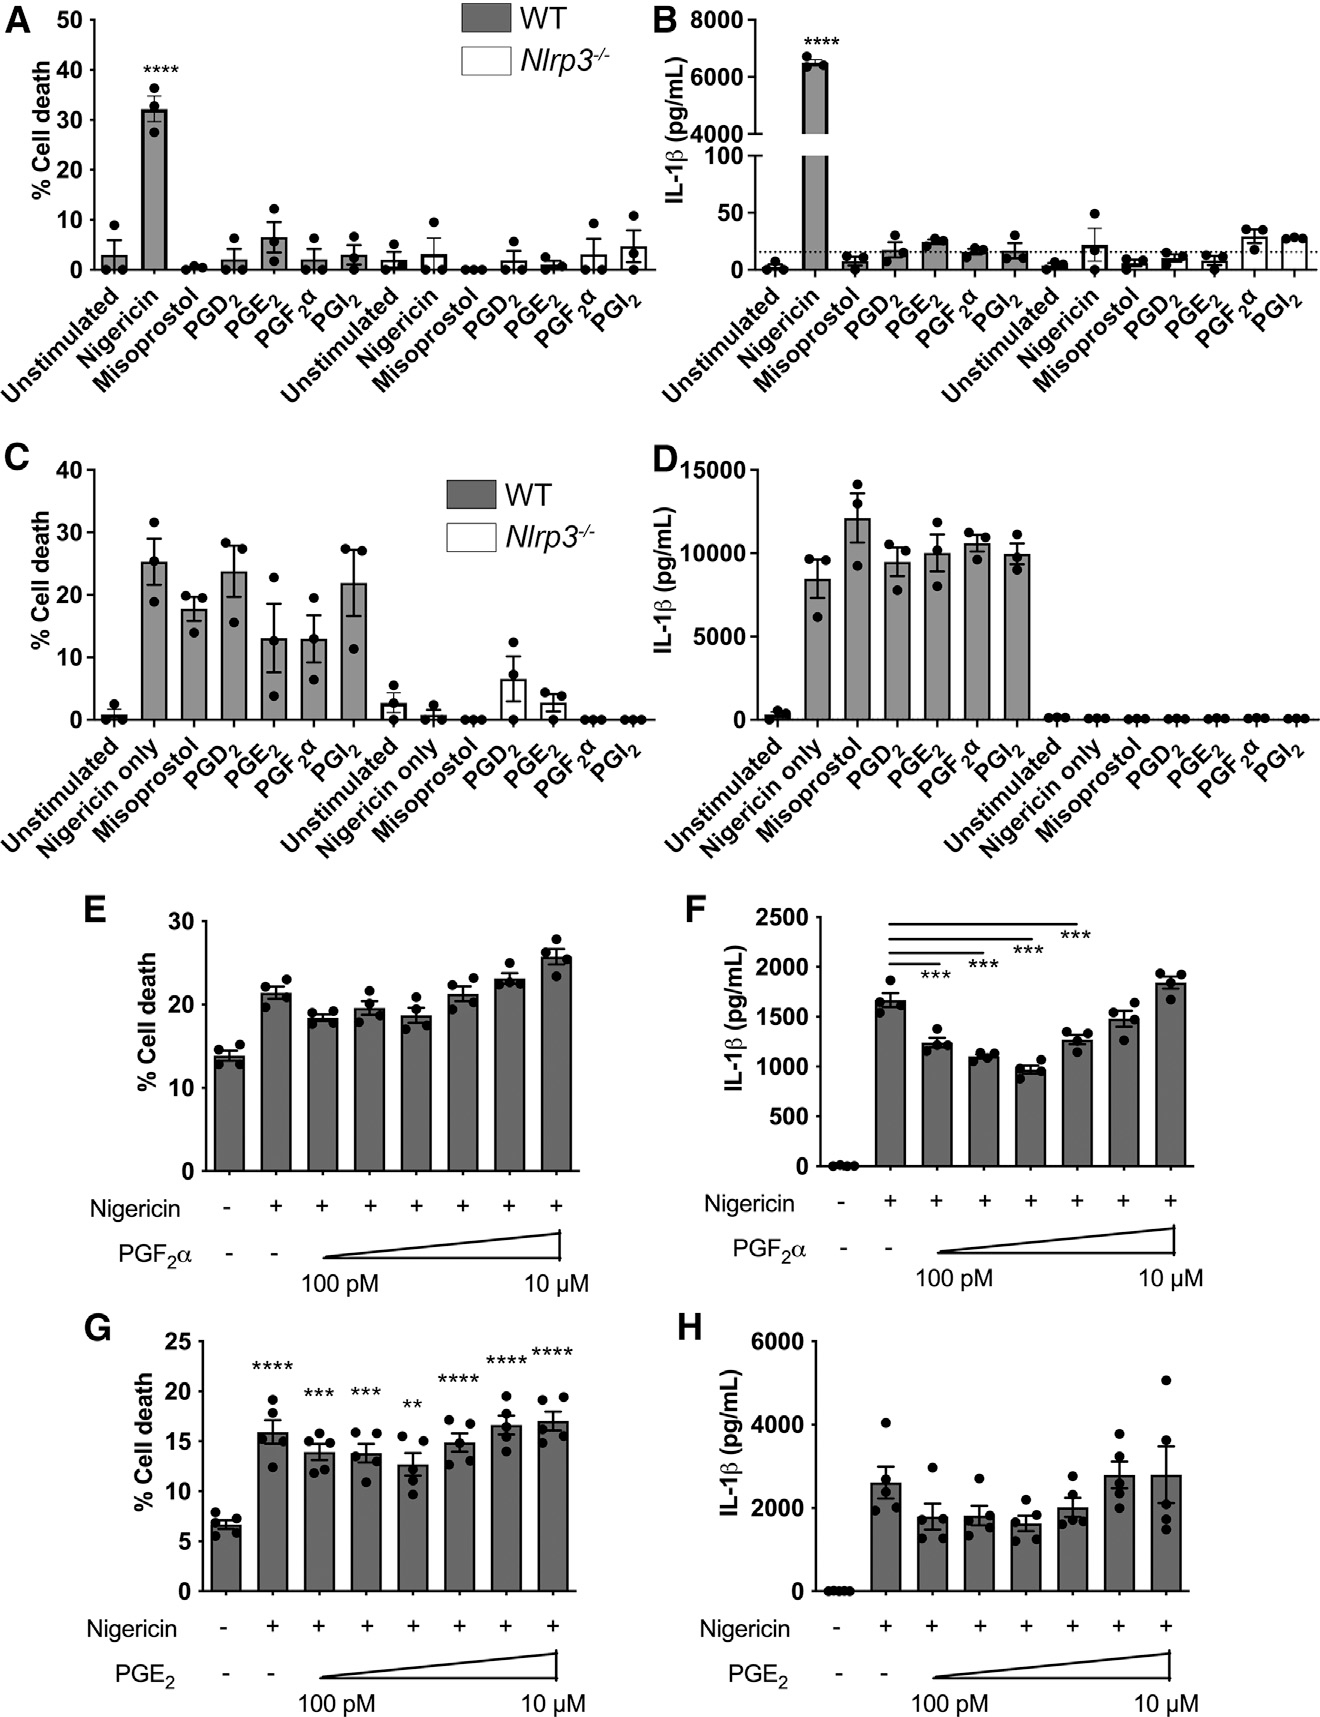
Figure 4. Individual eicosanoids have little effect on NLRP3 activity.

(A-D) Cell death (A and C), and IL-1β (B and D) produced by LPS-primed (200 ng/mL for 3 h) WT and Nlrp3−/− BMDMs in response to 1 h stimulation with 1 μM misoprostol, PGD2, PGE2, PGF2α, and PGI2.
(E-H) Cell death (E and G) and IL-1β (F and H) produced by LPS-primed WT BMDMs in response to 1 h stimulation with 10 mM nigericin in presence of increasing concentrations of PGF2α (E and F) and PGE2 (G and H).
*p < 0.05, **p < 0.01, ***p < 0.001, and ****p < 0.0001 in comparison to untreated controls unless indicated otherwise (one-way analysis of variance with Tukey’s multiple comparison test). Dashed line represents the assay detection limit. Data are from three (A-D) or four (E-H) independent experiments (mean and SEM).
