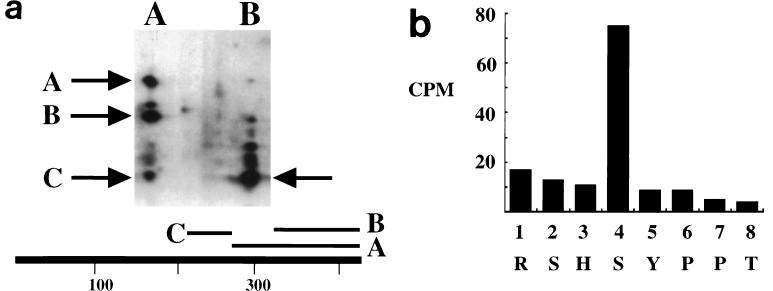
FIG. 1.
(a) Phosphorylation of MT. MT was labeled in vivo with 32PO4 (right) or in vitro with [32P]ATP (left). After resolution on cylindrical gels, the MT was digested with S. aureus V8 protease in the second dimension. The major peptides are indicated by the arrows, and their positions in the MT sequence are indicated below the gel. (b) Edman degradation of phosophrylated MT produced in Sf9 cells. The 32P released by each turn of Edman degradation of the cyanogen bromide fragment was measured by Cerenkov counting. Each cycle of Edman degradation is shown with the corresponding Py MT sequence indicated underneath.

