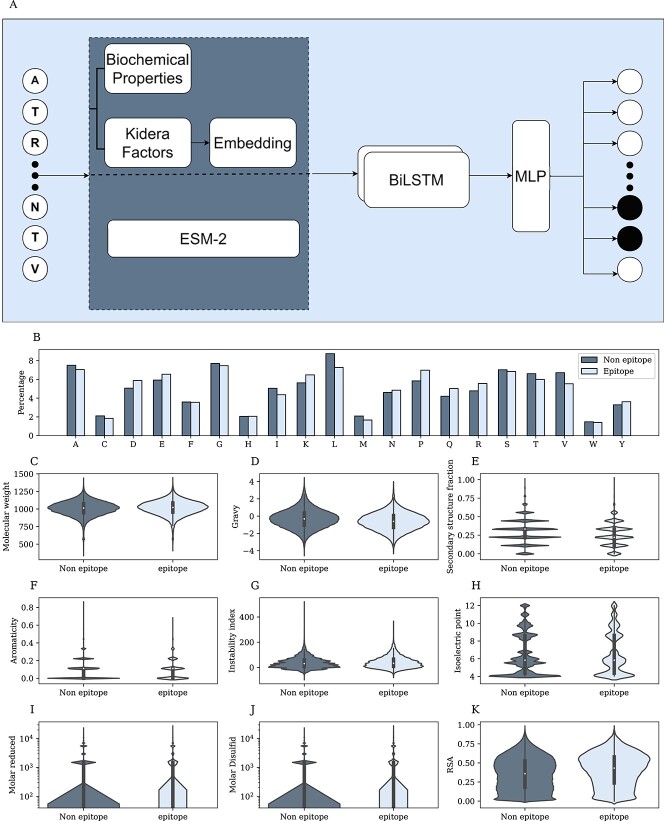
Figure 1.
Linear epitopes. A) Model architecture. First, choose an encoding for each residue—ESM-2, Kidera factors. Then embed the vector and concatenate it to the biochemical properties of the residue. The combined sequence is the input of a BiLSTM, and the output is the input of an MLP. B) Percentage of each AAa from the protein sequences that are epitopes(light color) and non-epitope (dark color). C-J) Distribution of epitope and non-epitope for different properties, where each residue was represented by the average feature of the ninemer around it. I-J) Y-axis in log scale. K) RSA distribution of epitope and non-epitope residues.

