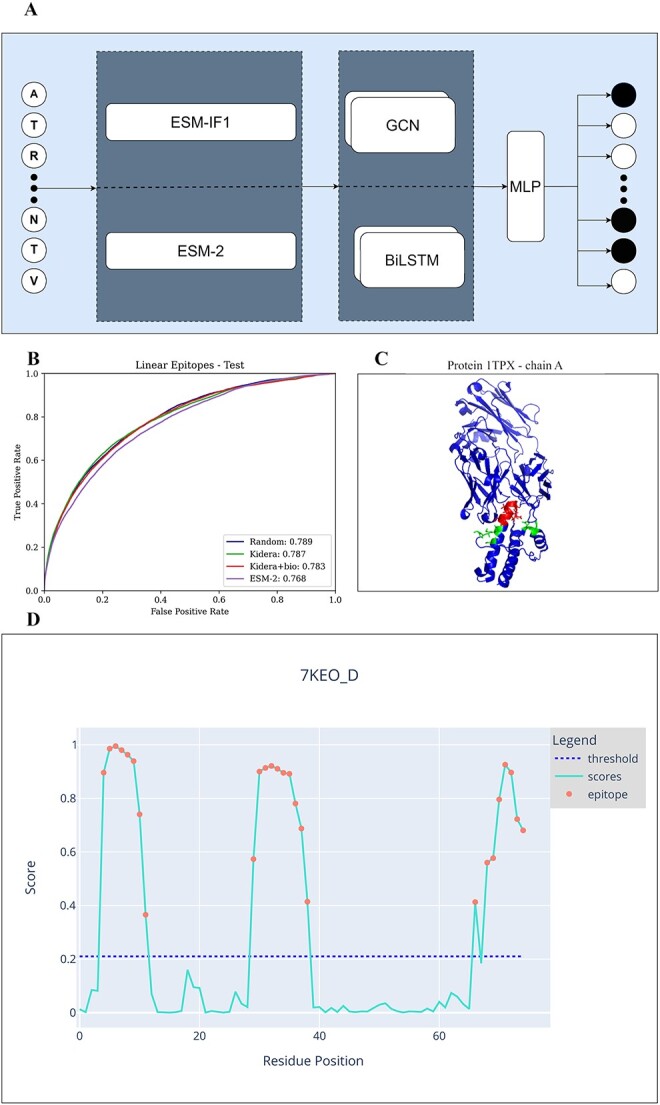
Figure 2.

A) Model architecture. First, choose an encoding - ESM-2 or ESM-IF1. Then, the whole sequence is the input of either a BiLSTM or GCN. Finally, the output of these models is the input of an MLP.B) Chain A of the protein 1TPX. Residues that are part of a linear epitope are colored red, residues that are part of a Conformational epitope are colored green, and those that are not a part of an epitope are colored blue. C) ROC curve of linear epitopes on the test sets of all 4 methods. D) An example of the graphical diagram that the CALIBER website produces for each protein in the input. The x-axis represents the residue position, and the y-axis the CALIBER scores. The dashed line represents the threshold. Each residue with a score over the threshold is colored in red. The threshold can be set on the website.
