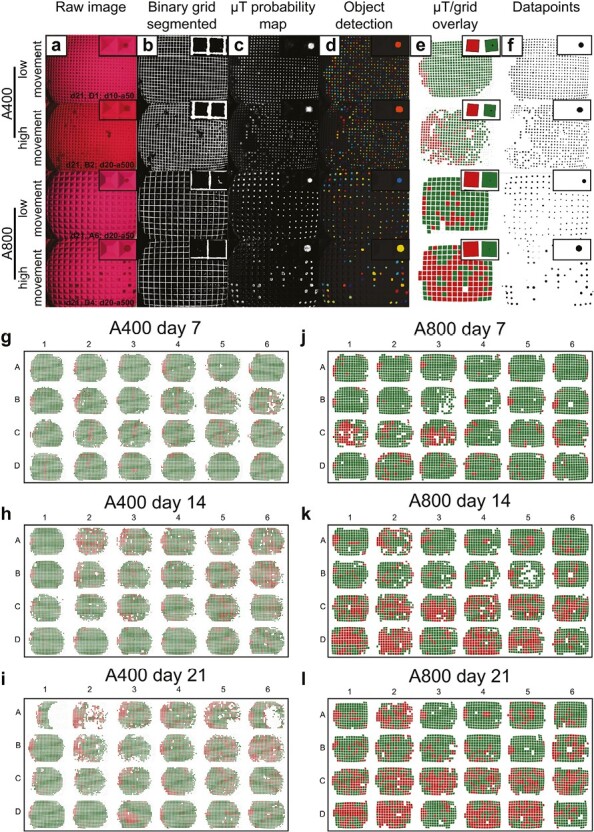
Figure 2.

Image analysis pipeline. (a) Representative raw images of large and small microwells with high and low microtissue movement. (b) For each image, the microwell grid was segmented and (c) a microtissue probability map of all pixels was generated. (d) Individual spheroid objects were identified and (e) overlayed on the microwell grid. (f) Microtissue size distribution in a well. (g-l) 24 well plate digitalization for A400 and A800 and individual well tracking over time. Each microwell is colored according to whether it contains a microtissue or not.
