
Figure 4.
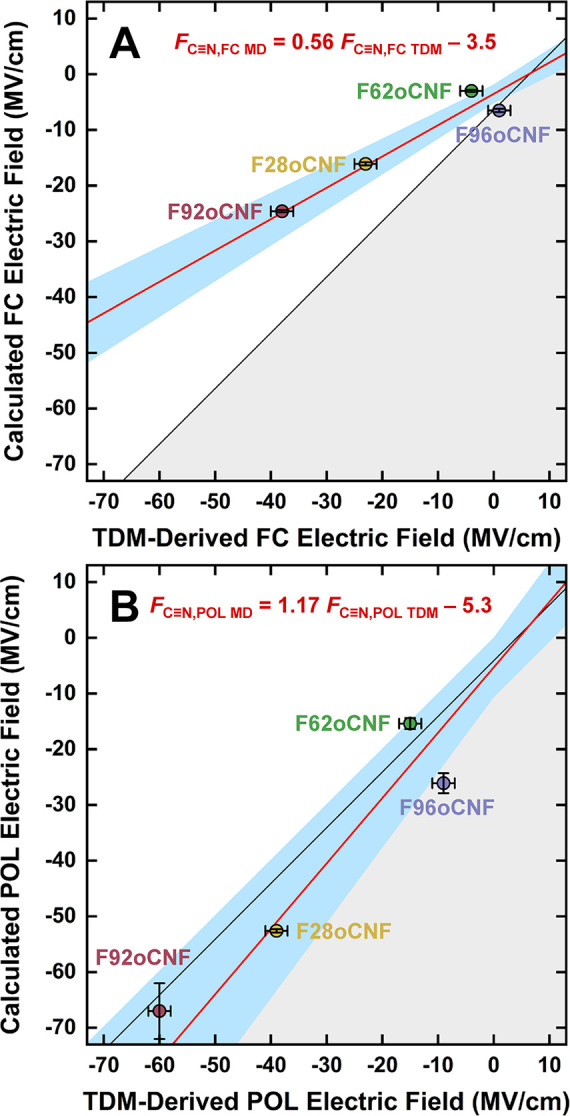
Comparisons of fraction-weighted FC≡N,MD and FC≡N,TDM values for PYP variants indicate POL MD can better recapitulate TDM-derived electric fields than FC MD. FC≡N,TDM values are derived from oTN-based electric field-TDM calibrations using either FC (A) or POL (B) MD;24FC≡N,MD values come from MD of proteins using the same FFs. Black lines represent perfect agreement between electric fields derived from TDMs and MD simulations: they have unit slope and are shifted from the diagonals due to offsets arising from the imperfect transferability of the small molecule oTN calibrations to the case where oCNF is incorporated into the protein (i.e., FC≡N,FC MD = FC≡N,FC TDM – 6.4 and FC≡N,POL MD = FC≡N,POL TDM – 4.1, see Section S1 for details). Points in the gray area below the black line have overestimated FC≡N,MD values, while points in the white area above the line have underestimated FC≡N,MD values. Weighted linear regressions45,46 are shown in red, and their equations are FC≡N,FC MD = (0.56 ± 0.04) FC≡N,FC TDM – (3.5 ± 0.8) (A) and FC≡N,POL MD = (1.17 ± 0.09) FC≡N,POL TDM – (5.3 ± 2.7) (B). The blue-shaded regions indicate 2σ CIs for regressions.