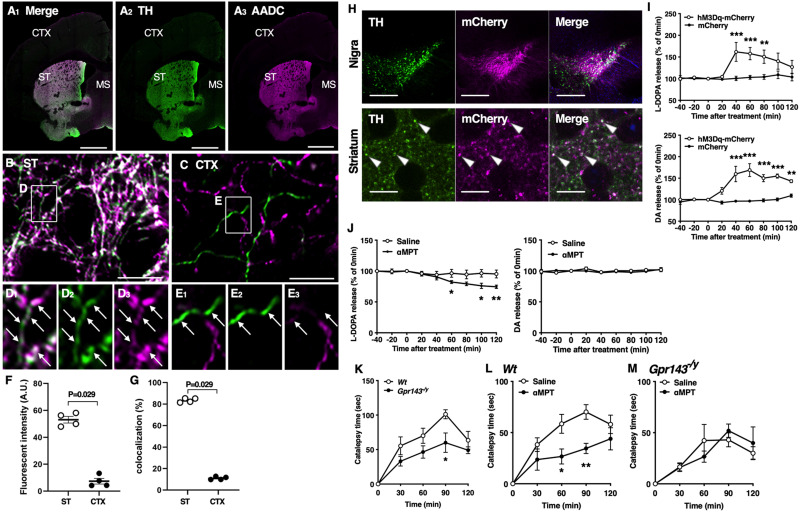
Figure 1.
Presence and release of L-DOPA in the nigrostriatal dopaminergic neurons. A–E, Double immunofluorescence showing the expression of TH (green) and AADC (magenta) protein in the cerebral cortex (CTX) and striatum (ST). Enclosed region in B (ST) and C (CTX) is magnified (in D) and E, respectively. Arrows indicate TH-positive varicosities. D, Note that although most TH-positive terminals show intense AADC signals, some of them show only weak signals in the ST. Scale bar, 1 mm in A; 10 μm (in B, C). F, Quantitative analysis showing the fluorescence intensity of AADC in TH-positive terminals. Note that AADC expression is significantly higher in ST than in CTX (n = 4, Mann–Whitney U test). G, Quantitative analysis showing the percentage of AADC-expressing regions in TH-positive regions. In ST, intense AADC signals are detected in most but not all TH-positive regions (n = 4, Mann–Whitney U test). H, TH (green) and mCherry (magenta) signals in the substantia nigra (upper) and dorsolateral striatum (lower) of Dat-cre mice after infection with AAV2/1-DIO-hM3Dq-mCherry. Arrowheads indicate colocalization of TH and mCherry. Scale bars, 200 and 10 µm in the substantia nigra and striatum, respectively. I, L-DOPA (upper) and DA (lower) release from the dorsolateral striatum before and after treatment with clozapine-N-oxide (3 mg/kg, i.p.) in Dat-cre mice infected with AAV2/1-DIO-hM3Dq-mCherry (hM3Dq-mCherry) or -mCherry in the substantia nigra (drug, F(1,6) = 6.496, p = 0.044, time, F(8,48) = 6.732, p < 0.0001, drug × time, p < 0.001 for L-DOPA and drug, F(1,6) = 34.91, p = 0.001, time, F(8,48) = 13.04, p < 0.0001, drug × time, F(8,48) = 12.08, p < 0.0001 for DA, n = 5). J, L-DOPA (left) and DA (right) release before and after treatment with αMPT (3 mg/kg, i.p.) or saline in the dorsolateral striatum of Wt mice (drug, F(1,8) = 12.54, p = 0.008, time, F(2.891,23.13) = 16.77, p < 0.001, drug × time, p < 0.001 for L-DOPA and drug, F(1,8) = 0.353, p = 0.569, time, F(3.833, 30.66) = 1.302, p = 0.292, drug × time, p = 0.715 for DA, n = 5). K, L, M, Decrease in the L-DOPA release attenuates haloperidol-induced catalepsy through GPR143. K, Time course of catalepsy after treatment with haloperidol (0.5 mg/kg) in Wt and Gpr143−/y mice (F(1,10) = 7.368, p = 0.022, n = 6). L, M, Time course of haloperidol-induced catalepsy after treatment with αMPT. αMPT (3 mg/kg) was applied simultaneously with haloperidol in (L) Wt (saline/haloperidol, F(1,16) = 7.938, p = 0.047, n = 9) and (M) Gpr143−/y mice (saline/haloperidol, F(1,10) = 0.005, p = 0.943, n = 6). All values are the mean ± standard error of the mean. *P < 0.05, **p < 0.01, ***p < 0.001, two-way ANOVA with Bonferroni’s multiple comparisons test.

