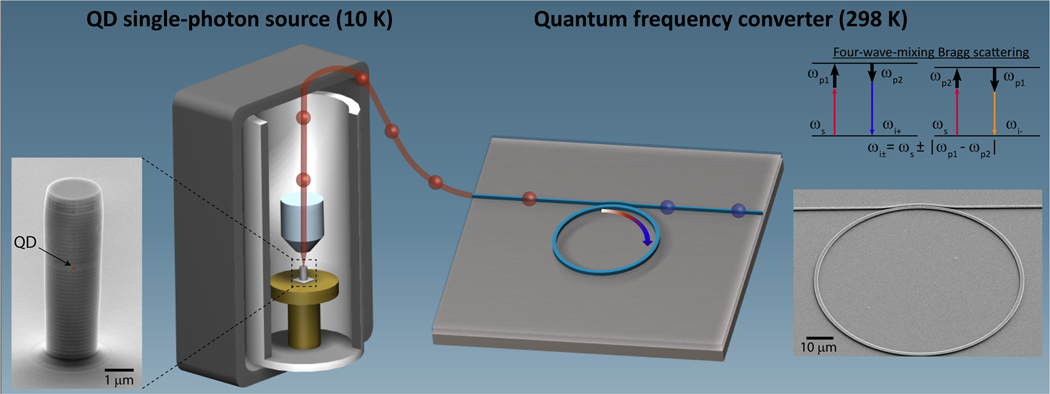
FIG. 2. Overview of the experiment.
Single photons from the source chip (QD in a micropillar cavity housed in a 10 K cryostat) are out-coupled via optical fiber and sent to a frequency converter chip (microring resonator) operating at room-temperature. An energy diagram depicting the four-wave mixing Bragg scattering process used for frequency conversion is shown in the top right, where two pumps ( and ) shift the input signal () to idlers at frequencies and . The output of the frequency converter is a superposition of the remnant (unconverted) signal and the two idlers, with filtering used to select a specific spectral channel. Scanning electron microscope images of the single-photon source and frequency converter are shown on the left and right sides of the image, with the inferred location of the QD indicated.

