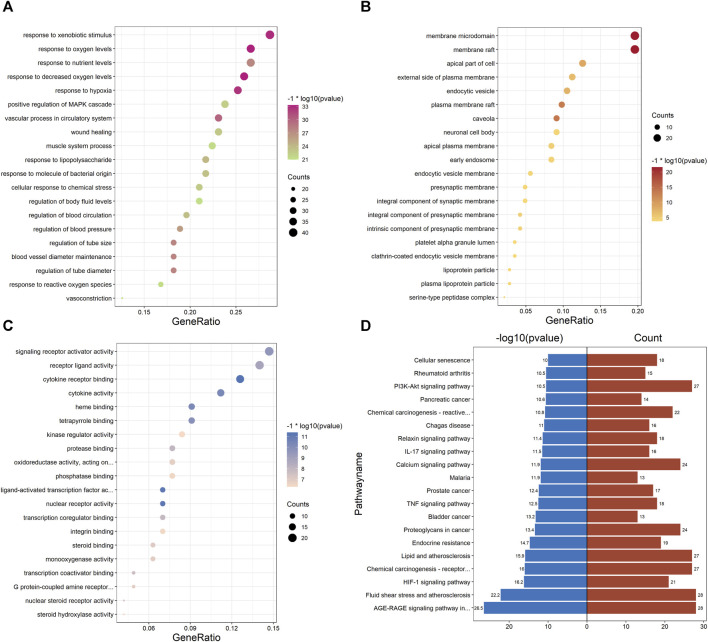
FIGURE 6.
GO and KEGG pathway enrichment analyses of PPI network. (A) Bubble diagram of the top 20 biological processes. (B) Bubble diagram of the top 20 cellular components. (C) Bubble diagram of the top 20 molecular functions. The color was adjusted according to −1* log10 (p-value) and the size of the dots was adjusted according to the number of genes. (D) Bidirectional histogram of the top 20 KEGG pathways. Blue bars represent −1*log10 (p-value) and red bars represent the number of genes.

