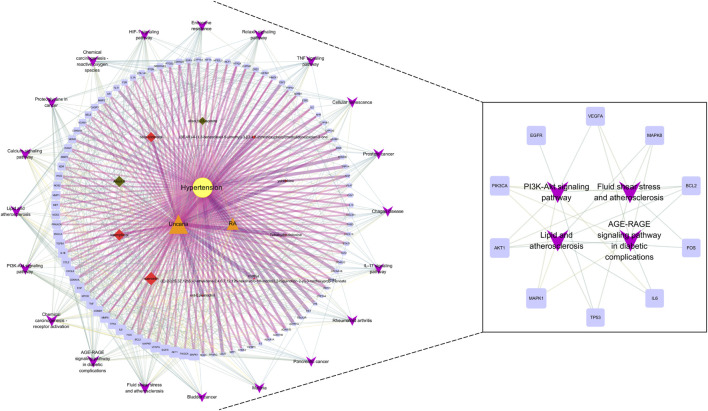
FIGURE 8.
Core component-target-pathway network. The yellow nodes represent HT. The orange nodes represent UR and AP. The red nodes represent the bioactive components of UR, and the green nodes represent the bioactive components of AP. The blue nodes represent relevant targets. The purple nodes represent the top 20 signaling pathways from the enrichment analysis. The node sizes were ordered by degree. The thickness and color shading of the edges were set according to the degree of interaction between the nodes.

