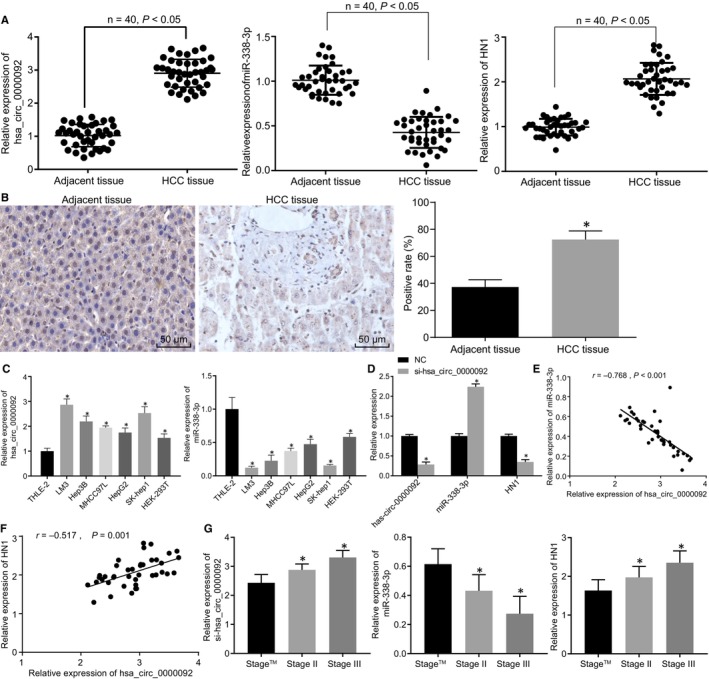
FIGURE 2.

HCC tissues and cells exhibit up‐regulated hsa_circ_0000092 and HN1 but down‐regulated miR‐338‐3p. A, Expression of hsa_circ_0000092, miR‐338‐3p and HN1 in HCC and adjacent normal tissues measured by RT‐qPCR. B, The positive expression of HN1 in HCC and adjacent normal tissues determined by IHC (original magnification ×200). C, Expression of hsa_circ_0000092 and miR‐338‐3p in cell lines (Hep3B, LM3, MHCC97L, SK‐hep1, HepG2 and THLE‐2), as measured by RT‐qPCR. D, Expression of hsa_circ_0000092, miR‐338‐3p and HN1 in LM3 cells treated with NC or si‐hsa_circ_0000092 determined by RT‐qPCR. E, Correlation between hsa_circ_0000092 and miR‐338‐3p expression analysed using Pearson's correlation analysis. F, Correlation between hsa_circ_0000092 and HN1 expression analysed using Pearson's correlation analysis. G, Analysis of the relationship between the expression of hsa_circ_0000092, miR‐338‐3p, HN1 and the clinicopathological characteristics of patients with HCC. In panel A and B, *P < .05, vs adjacent normal tissues; the data (mean ± standard deviation) between two groups were analysed using paired t test. n = 40. In panel C, *P < .05, vs THLE‐2 cells; data among multiple groups were analysed using one‐way ANOVA, followed by Tukey's post hoc test; n = 40. In panel D, *P < .05, vs LM3 cells treated with NC; data between two groups were analysed using unpaired t test; In panel G, *P < .05, vs stage I. The experiment was repeated three times
