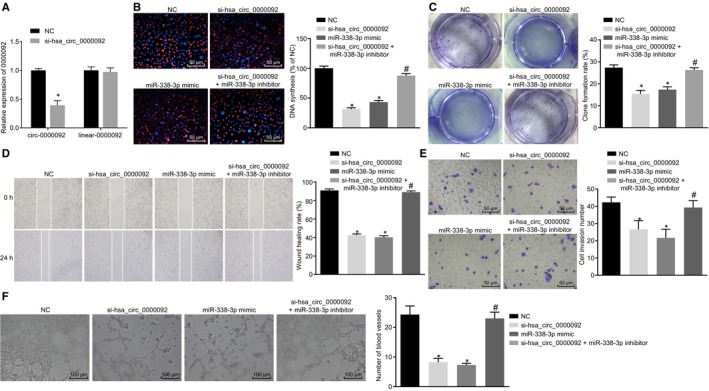
FIGURE 4.

hsa_circ_0000092 promotes LM3 cell proliferation, invasion, migration and angiogenesis by binding to miR‐338‐3p. A, Expression of circ_0000092 and linear_0000092 in LM3 cells in response to NC treatment and si‐hsa_circ_0000092 treatment, as determined by RT‐qPCR. B, Representative views of EdU staining (original magnification ×200) and DNA synthesis of LM3 cells treated with NC, miR‐338‐3p mimic, si‐hsa_circ_0000092, or combined si‐hsa_circ_0000092 and miR‐338‐3p inhibitor, as determined using EdU assay. C, Colony formation rate of LM3 cells treated with NC, miR‐338‐3p mimic, si‐hsa_circ_0000092, or combined si‐hsa_circ_0000092 and miR‐338‐3p inhibitor, as determined by colony formation assay. D, Migration ability of LM3 cells treated with NC, miR‐338‐3p mimic, si‐hsa_circ_0000092, or combined si‐hsa_circ_0000092 and miR‐338‐3p inhibitor, as measured by scratch test. E, Invasion ability of LM3 cells treated with NC, miR‐338‐3p mimic, si‐hsa_circ_0000092, or combined si‐hsa_circ_0000092 and miR‐338‐3p inhibitor, as detected using Transwell assay (original magnification ×200). F, Representative views of blood vessels (original magnification ×100) and angiogenesis ability of LM3 cells treated with NC, miR‐338‐3p mimic, si‐hsa_circ_0000092, or combined si‐hsa_circ_0000092 and miR‐338‐3p inhibitor, as detected using vessel‐like tube formation in vitro. The data (mean ± standard deviation) among multiple groups were analysed using one‐way ANOVA, followed by Tukey's post hoc test. *P < .05, vs LM3 cells treated with NC; #P < .05, vs LM3 cells treated with si‐hsa_circ_0000092. The experiment was repeated three times
