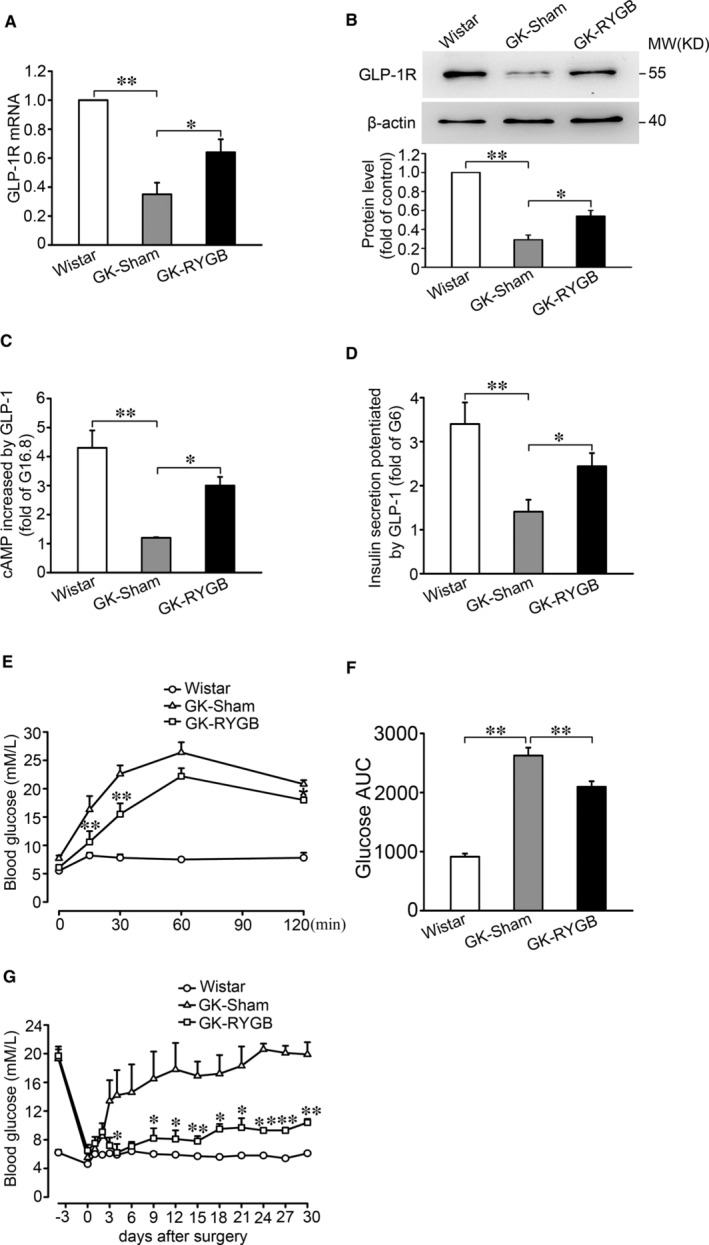
Figure 5.

Expression of GLP‐1R in islets of GK rats after RYGB. A, B, The expression of GLP‐1R mRNA (A) and protein (B) in islets from Wistar, GK‐Sham and GK‐RYGB rats. Bars represent means ± SEM of 4 (A) and 3 (B) independent experiments. *P < 0.05; **P < 0.01. C, cAMP levels were determined in islets from Wistar, GK‐Sham and GK‐RYGB rats. The islets were stimulated with 16.8 mmol/L glucose in the absence or presence of 10 nmol/L GLP‐1 for 30 min. Values were normalized to islets and expressed as fold changes of the islets stimulated with 16.8 mmol/L glucose alone. Bars represent means ± SEM, n = 4. *P < 0.05; **P < 0.01. D, Insulin secretion was stimulated by 6 mmol/L glucose and 10 nmol/L GLP‐1 for 30 min in islets from Wistar, GK‐Sham and GK‐RYGB rats. Values were presented as fold increase at 6 mmol/L glucose. Bars represent means ± SEM, n = 4 per group. *P < 0.05; **P < 0.01. E, Glucose levels at 0, 15, 30, 60 and 120 min after administration of 2 g/kg glucose by oral gavage in Wistar, GK‐Sham and GK‐RYGB rats. Data represent means ± SEM, n = 3‐6 rats per group. **P < 0.01 vs. GK‐Sham. F, Area under the curves (AUC) was calculated for OGTT. Data are means ± SEM, n = 3‐6 rats per group, **P < 0.01. G, Non‐fasting plasma glucose was collected at 10:00 AM on the indicated days in Wistar, GK‐Sham and GK‐RYGB rats. Data represent means ± SEM, n = 3. *P < 0.05; **P < 0.01 vs. GK‐Sham
