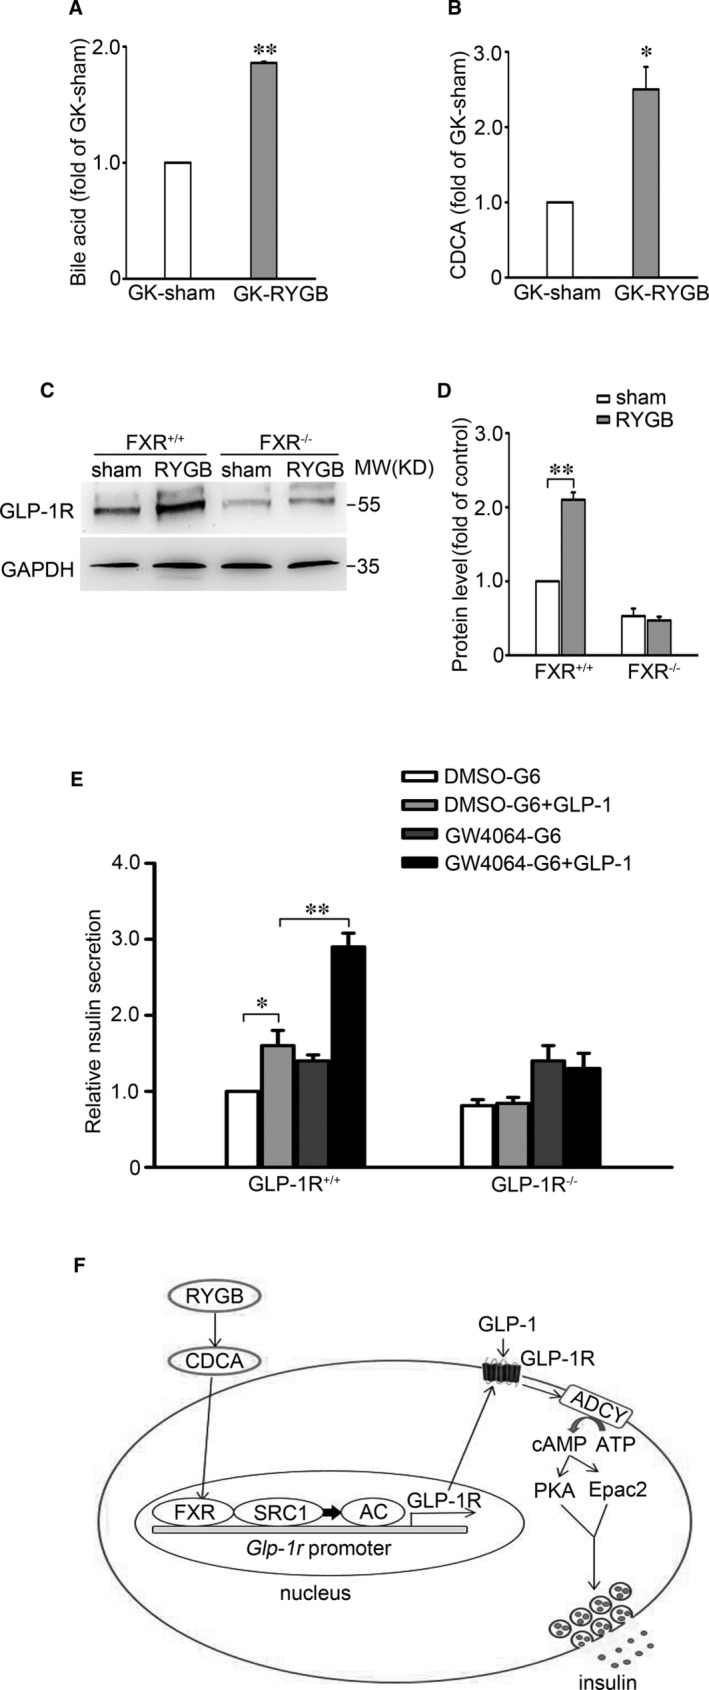
Figure 6.

Absent of RYGB‐increased GLP‐1R expression in FXR−/− mice. A, B, The levels of plasma total bile acids (A) and CDCA (B) in GK‐Sham and GK‐RYGB rats. Bars represent means ± SEM, n = 3. *P < 0.05; **P < 0.01. C, The GLP‐1R protein expression in islets from FXR+/+ and FXR−/− mice after RYGB or sham surgery. GAPDH was used as internal control. D, Statistical analysis of the data from (C). Bars represent means ± SEM, n = 3. **P < 0.01. E, Insulin secretion was determined in islets from GLP‐1R+/+ and GLP‐1R−/− mice. The islets were cultured in the medium containing 5 μmol/L GW4064 or DMSO for 48 h, followed by stimulation with 6 mmol/L glucose or 6 mmol/L glucose and 10 nmol/L GLP‐1 for 30 min. Bars represent means ± SEM, n = 3‐5. *P < 0.05; **P < 0.01. F, Schematic representation of the molecular mechanism of FXR/SRC1‐controlled expression of GLP‐1R in β‐cells after RYGB. See text for details
