
FIGURE 5.
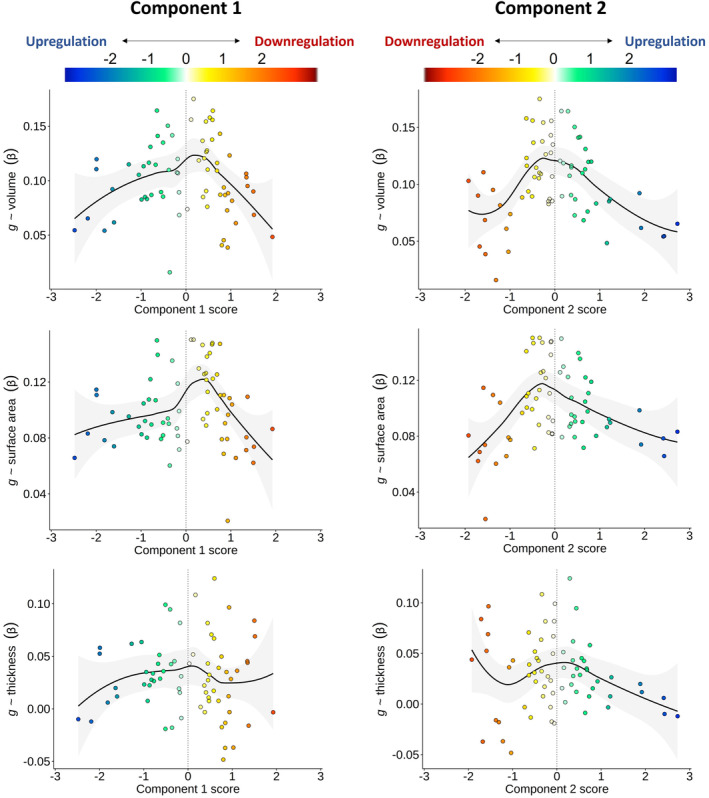
Associations between regional‐g profiles and the two gene expression components. LOESS functions are plotted (the quadratic model results are comparable to the absolute score correlations and are presented in Table S24). A vertical line at component scores of 0 represents a balance between upregulation and downregulation ends of each component. The colour scale is flipped between Components, so that the direction of downregulation and upregulation match.