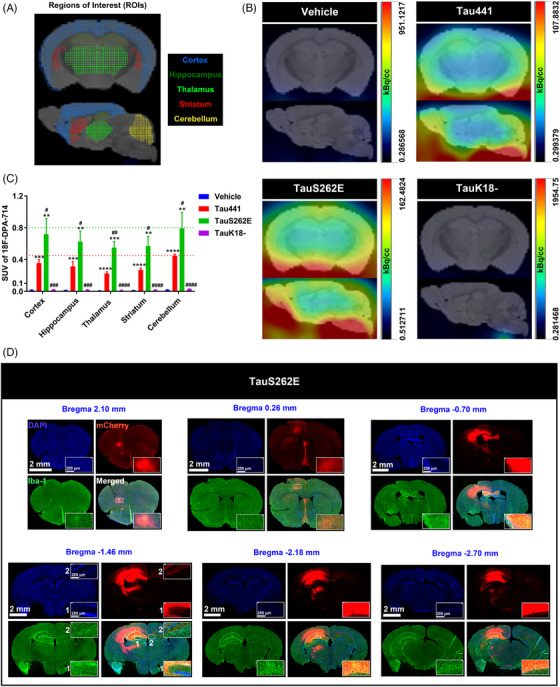
FIGURE 6.

Spatial characteristics of Tauopathy and its association with activation of microglia in TauS262E overexpression model. (A) Schematic diagram of mouse brain regions of interest (coronal and sagittal section: cortex, hippocampus, thalamus, striatum and cerebellum) in positron emission tomography/computed tomography (PET/CT) imaging. (B) Representative coronal and sagittal 18F‐DPA‐714 (a ligand of the 18–kDa translocator protein [TSPO] to trace the active microglia) PET/CT images of the mice from four groups (vehicle, Tau441, TauS262E and TauK18–). (C) In vivo 18F‐DPA‐714 uptake in different brain regions of the mice in four groups is presented as standard uptake values (SUVs). n = 3 mice per group, ** p < .01, *** p < .001, **** p < .0001 versus vehicle group, # p < .05, ## p < .01, ### p < .001, #### p < .0001 versus Tau441 group. (D) Representative images of Iba‐1 immunofluorescence (green, a marker of microglia) in different coronal sections of TauS262E overexpressed brain with the nuclei and overexpressed TauS262E protein labelled by DAPI (blue) and mCherry (red), respectively, displaying the spatial distribution relationship between activated microglia and TauS262E protein. Scale bar = 2 mm or 200 µm.
