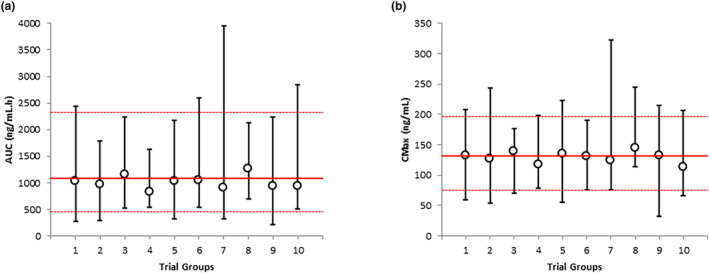
FIGURE 2.

Simulated and observed variability in PQ plasma concentrations in women at postpartum. Simulated (symbols and black lines) and observed (red lines) variability in plasma exposure of PQ after 0.5 mg/kg daily dosing of PQ in nursing mothers. Median and range are shown for AUC (a) and C max (b) for each virtual trial and the observed data. AUC, area under the curve; C max, maximum plasma concentration; PQ, primaquine.
