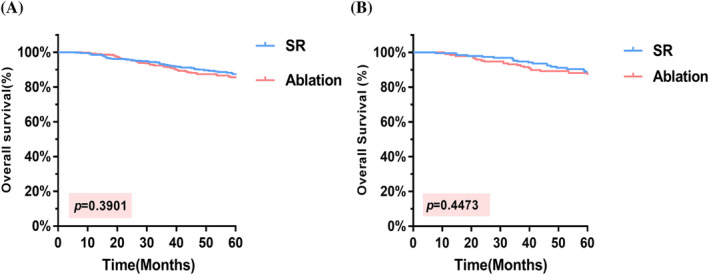
FIGURE 2.

K–M curves comparing OS. (A) In the total cohort, the 5‐year OS rate was 88.2% in the SR group and 86.7% in the ablation group. (B) After PSM, the 5‐year OS rates were observed to be 89.9% and 88.3%, respectively. OS, overall survival; PSM, propensity score matching; SR, surgical resection.
