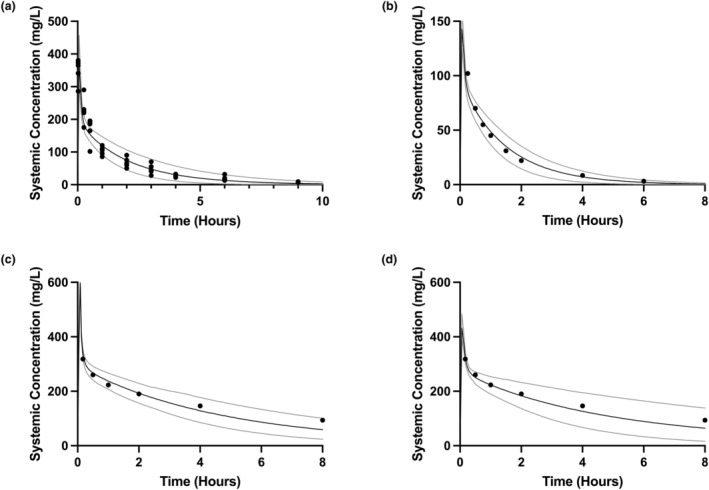
FIGURE 1.

Visual validation of fosfomycin adult, pediatric, and neonatal PBPK models. The black solid line indicates the mean systemic concentration predicted by the PBPK model, with gray solid lines indicating 5th and 95th centiles, from 100 simulated individuals for each validation. The overlying symbols indicate observed concentrations from the test dataset. (a) Adult fosfomycin PBPK model simulating a 50 mg/kg i.v. bolus in adult healthy volunteers, with overlaid individual observed data from Segre et al. 17 (b) Pediatric fosfomycin PBPK model simulating a 25 mg/kg i.v. bolus in children aged 3–8 years, with overlaid population mean observed data from Guggenbichler et al. 27 (c) Initial neonatal fosfomycin PBPK model simulating a 100 mg/kg i.v. bolus in neonates aged 0–23 days, with overlaid population mean observed data from Kane et al. 8 (d) Adjusted neonatal fosfomycin PBPK model (with Kp scalar of 1.2) simulating 100 mg/kg i.v. bolus in neonates aged 0–23 days, with overlaid population mean observed data from Kane et al. 8 PBPK, physiologically‐based pharmacokinetic.
