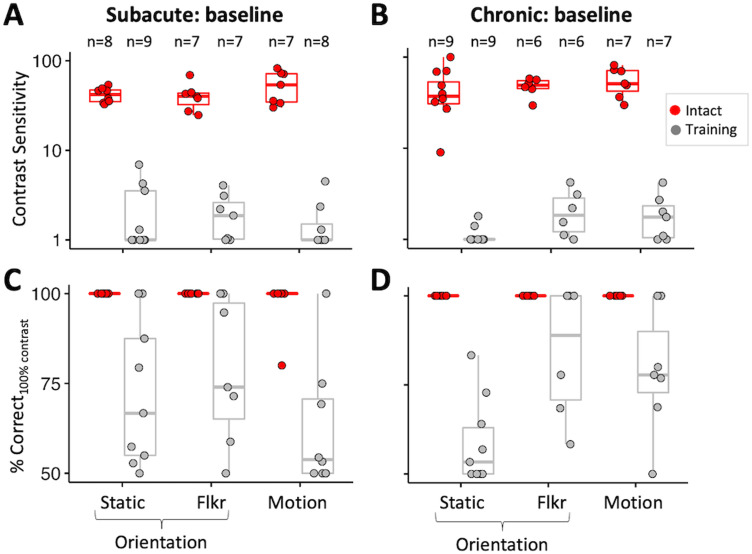
Figure 5.
Baseline performance on all three discrimination tasks. A, Plot of CS for orientation discrimination of static Gabors (Static), flickering Gabors (Flkr), and direction discrimination of drifting Gabors (Motion) in subacute participants at selected training locations and corresponding, intact-field locations. Each data point represents a single location. Red-filled circles indicate performance at corresponding intact-field locations; gray-filled circles denote locations selected for training. Box plots indicate the median (line within the box), 25–75% quartile range (box), and 10–90% range (whiskers). B, Plot of CS for the same three tasks in chronic participants at locations selected for training and their corresponding intact-field locations. Labeling conventions as in A. C, Baseline percent correct performance on three tasks for 100% contrast stimuli measured in subacute participants. Labeling conventions as in A and B. D, Baseline percent correct performance on three tasks for 100% contrast stimuli measured in chronic participants. Labeling conventions as in A–C.

