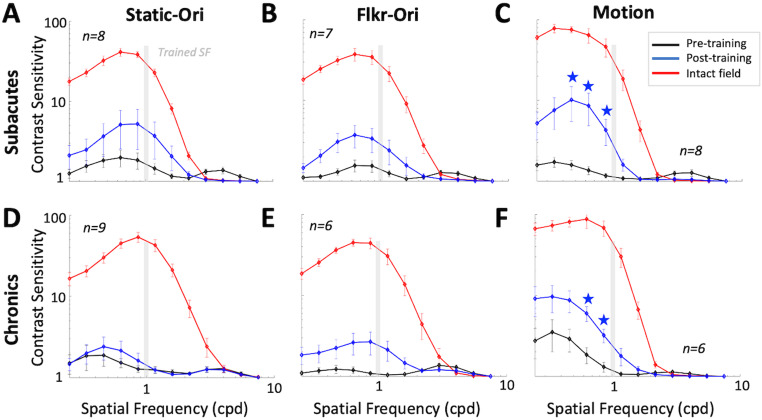
Figure 7.
Effect of training on CSFs for Static-Ori, Flkr-Ori, and Motion tasks in SA and CH participants. A, Mean pre- (black line) and post-training (blue line) CSFs for Static-Ori task in SA participants, at locations selected for training as well as corresponding, intact-field locations (red line). B, Corresponding CSFs for Flkr-Ori task in SA participants. Labeling conventions as in A. C, Corresponding CSFs for Motion task in SA participants. Labeling conventions as in A. D, Corresponding CSFs for Static-Ori task in CH participants. Labeling conventions as in A. E, Corresponding CSFs for Flkr-Ori task in CH participants. Labeling conventions as in A. F, Corresponding CSFs for Motion task in CH participants. Labeling conventions as in A. Error bars, SEM. Light gray vertical bars, trained SF (1 cpd). Within each graph, average CSs at each of the 12 SFs tested (0.10, 0.15, 0.22, 0.32, 0.48, 0.71, 1.05, 1.56, 2.31, 3.42, 5.07, 7.50 cpd) were corrected for multiple comparisons using Bonferroni’s correction, followed by bootstrapping analysis at each SF, with blue stars denoting p < 0.004.

