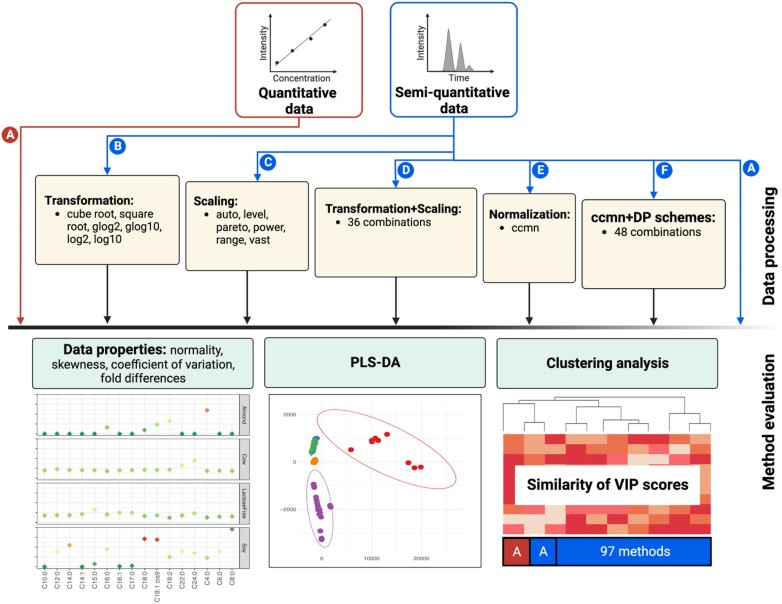
Figure 1:
Analysis workflow. Different DP schemes were performed in this study, including (A) no processing, (B) transformation, (C) scaling, (D) transformation followed by scaling, (E) normalization by ccmn, and (F) consisting of ccmn + transform, ccmn + scale, and ccmn + transform + scale. The methods of each DP scheme are listed, and the number shown represents all combinations of these methods. The DP schemes were applied to semiquantitative or peak area data (blue), and the method evaluations were then performed. This included effects on data properties and PLS-DA. For each dataset, the resulting VIPs from PLS-DA were compared to those of the quantitative data (red).

