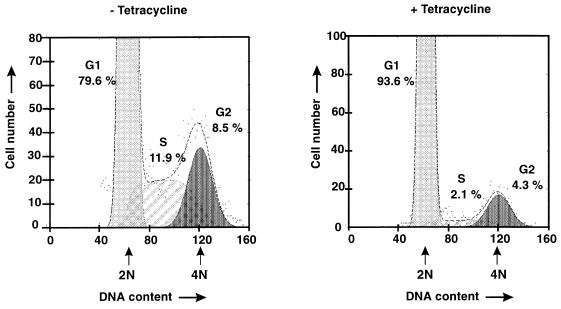
FIG. 4.
Cell cycle status in proliferating and nonproliferating tetracycline-treated Tesi cells. tax-expressing Tesi cells were cultured in either the presence (+) or absence (−) of tetracycline (1 μg/ml) for three doubling times, fixed, stained with propidium iodide, and subjected to flow cytometry. Apoptotic and dead cells were excluded from the analysis. The dots represent the direct results of the measurements. The lines indicate the relative calculated proportions of cells in the G1 (light grey), S (diagonally hatched), and G2 (dark grey) phases of the cell cycle. The x-axis indicates fluorescence representing the DNA content. Arrows indicate positions of cells with 2N and 4N DNA content.

