
Table 2.
Results of logistic regression analyses predicting the likelihood of alcohol service refusal
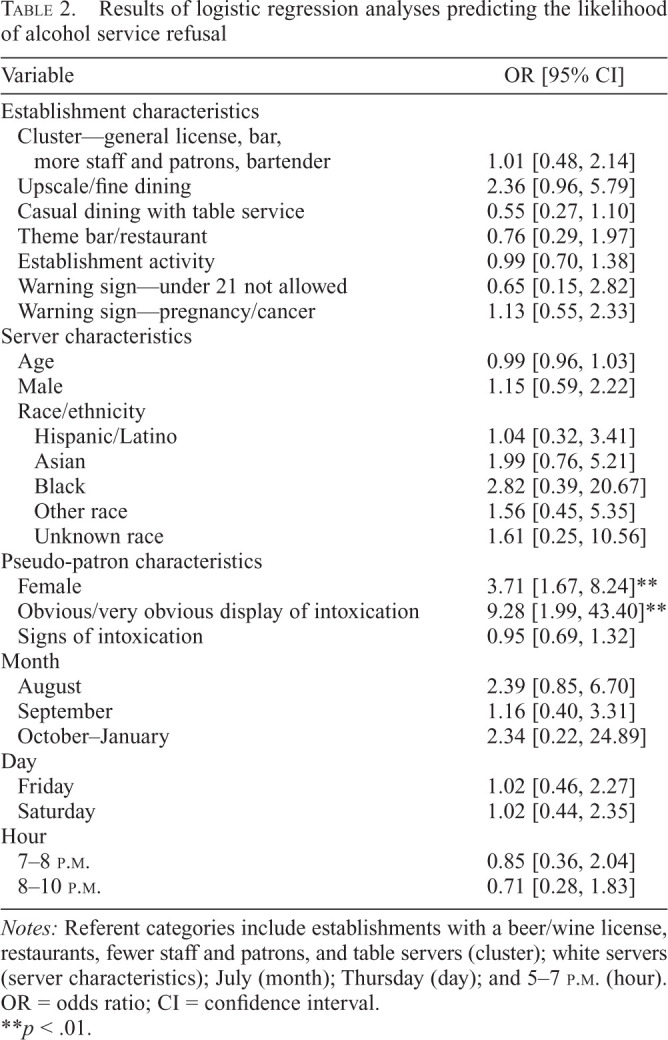
| Variable | OR [95% CI] |
|---|---|
| Establishment characteristics | |
| Cluster—general license, bar, more staff and patrons, bartender | 1.01 [0.48, 2.14] |
| Upscale/fine dining | 2.36 [0.96, 5.79] |
| Casual dining with table service | 0.55 [0.27, 1.10] |
| Theme bar/restaurant | 0.76 [0.29, 1.97] |
| Establishment activity | 0.99 [0.70, 1.38] |
| Warning sign—under 21 not allowed | 0.65 [0.15, 2.82] |
| Warning sign—pregnancy/cancer | 1.13 [0.55, 2.33] |
| Server characteristics | |
| Age | 0.99 [0.96, 1.03] |
| Male | 1.15 [0.59, 2.22] |
| Race/ethnicity | |
| Hispanic/Latino | 1.04 [0.32, 3.41] |
| Asian | 1.99 [0.76, 5.21] |
| Black | 2.82 [0.39, 20.67] |
| Other race | 1.56 [0.45, 5.35] |
| Unknown race | 1.61 [0.25, 10.56] |
| Pseudo-patron characteristics | |
| Female | 3.71 [1.67, 8.24]** |
| Obvious/very obvious display of intoxication | 9.28 [1.99, 43.40]** |
| Signs of intoxication | 0.95 [0.69, 1.32] |
| Month | |
| August | 2.39 [0.85, 6.70] |
| September | 1.16 [0.40, 3.31] |
| October–January | 2.34 [0.22, 24.89] |
| Day | |
| Friday | 1.02 [0.46, 2.27] |
| Saturday | 1.02 [0.44, 2.35] |
| Hour | |
| 7–8 p.m. | 0.85 [0.36, 2.04] |
| 8–10 p.m. | 0.71 [0.28, 1.83] |
Notes: Referent categories include establishments with a beer/wine license, restaurants, fewer staff and patrons, and table servers (cluster); white servers (server characteristics); July (month); Thursday (day); and 5–7 P.M. (hour). OR = odds ratio; CI = confidence interval.
**
p < .01.