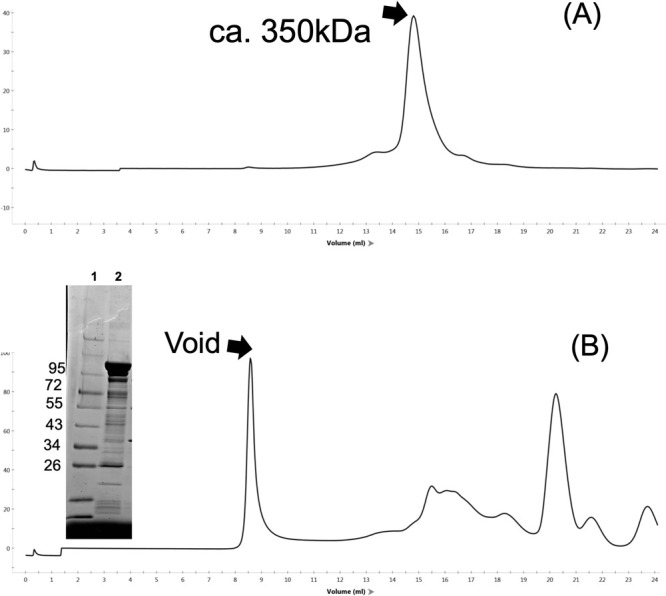
Figure 3 .

Elution profile of gel filtration. The protein samples (0.1 mL) of the cytoplasmic fraction of C (A) and the membrane fraction of CP (B) were run in a Superose 6 10/300 column with 20TN150 containing 1 mM MgCl2 and 0.05% dodecyl maltoside (DDM) at 0.5 mL/min flow rate. The proteins, 1: molecular weight markers, and 2: void fraction, were separated using SDS-PAGE and stained with CBB are shown in the inset of (B).
