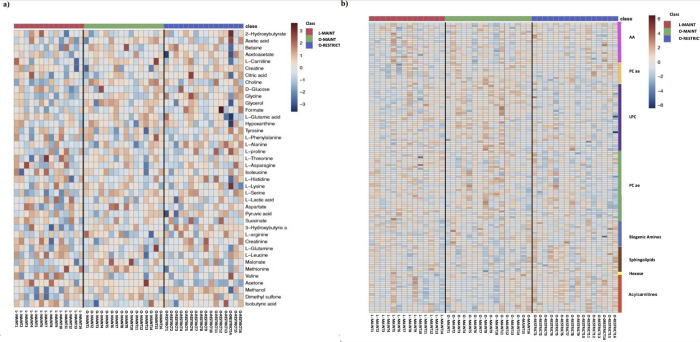
Fig 2.
Clustering result shown as heatmap of nuclear magnetic resonance (NMR) spectroscopy data (a) and direct infusion mass spectrometry (DI-MS) (b) (distance measured using Euclidean) from 14 lean (L-MAINT) and 16 obese cats during weight maintenance (O-MAINT) and after 10-week energy restriction (O-RESTRICT). LPC = Lysophosphatidylcholines, PC aa = Phosphatidylcholine diacyl, PC ae = Phosphatidylcholine acyl-alkyl.

