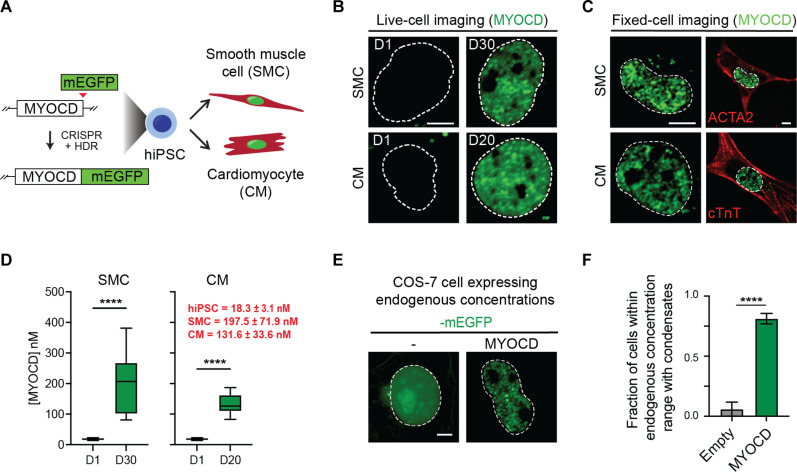
Fig. 2. MYOCD forms condensates during hiPSC differentiation into SMCs and CMs.
(A) Schematic of the creation of MYOCD-mEGFP knock-in hiPSC line and differentiation of hiPSCs into SMCs and CMs. (B) Live-cell imaging of endogenously tagged MYOCD-mEGFP in differentiation day 1 (D1) and mature hiPSC-derived SMC (D30) and CM (D20) nuclei. Scale bar, 5 μm. Dotted line denotes the nucleus, drawn using Hoechst 33342 staining (not shown). (C) Co-IF of MYOCD-mEGFP with smooth muscle α-actin (ACTA2) or cardiac troponin T (cTnT) in either mature hiPSC-derived SMCs and CMs, as labeled. Left column is zoomed in to highlight MYOCD condensates, and only the GFP channel is presented. Scale bar, 5 μm. Right column is zoomed out of the same cell to highlight cell body with cell marker stain. Scale bar, 5 μm. (D) Box plot (10 to 90%) of the concentration of MYOCD in hiPSCs compared to mature SMCs (left) or mature CMs (right). Red text denotes concentration of MYOCD as mean ± SD. P values from t test, ****P ≤ 0.0001. n = 10. (E) Representative micrographs (max projections) of COS-7 cells expressing mEGFP or MYOCD-mEGFP. The nuclear concentration of MYOCD-mEGFP in this micrograph is 124.6 nM, equivalent to physiological concentrations in SMCs and CMs, as shown in (D). The nuclear concentration of the mEGFP control is 718.9 nM. Dotted line defines nucleus from Hoechst 33342 staining (not shown). Scale bar, 5 μm. (F) Bar chart of the fraction of cells with condensates between the concentration range of MYOCD in SMCs and CMs, 98.0 to 268.4 nM [± SD of mean concentration measured in SMC and CM in (D)]. Condensates are identified by automated analysis pipeline. Data are mean ± SEM. P values from t test, ****P ≤ 0.0001. n ~ 25.

